| Corcoran Technical Trading Patterns for February 15 |
| By Clive Corcoran |
Published
02/15/2008
|
Stocks
|
Unrated
|
|
|
|
Corcoran Technical Trading Patterns for February 15
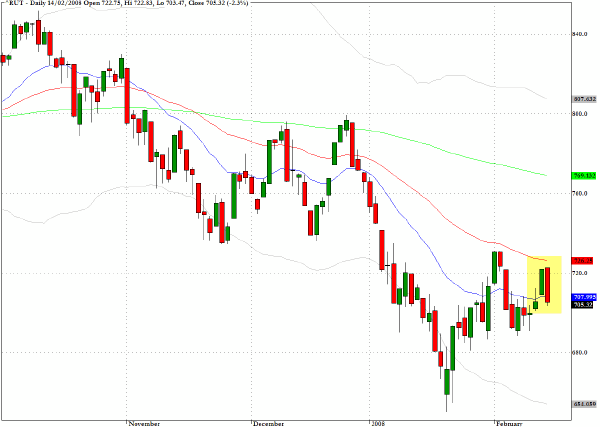
Chairman Bernanke, in an unusually candid testimony to the Senate Banking Committee, spooked the markets and halted the incipient rally. The Russell 2000 (^RUT) was the out-performer on the downside with a 2.3% loss for the session. As the chart reveals there is a lot of price activity between 720, which now more or less coincides with the 50-day EMA and 680 where there is evidence of chart support. A re-test of this level seems feasible in the near term and if the index should break to this level it seems quite conceivable that the intraday low of 650 exactly (recorded on January 22) may well become an attractor as well.
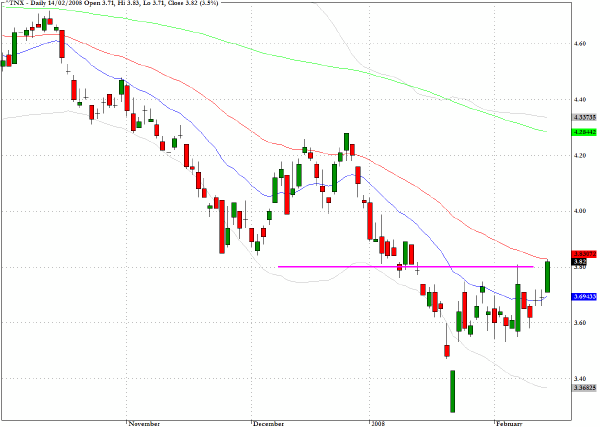
In yesterday's commentary on the ten year Treasury note I suggested that "The 3.8% yield level looks likely to be targeted again in the very near future". I must confess to being surprised that it was tested so immediately with a 13 basis point upward move registered for the session.
If we re-enter, and look like we are planning to stay for a while, the long standing channel between 3.75% and 5.25% this would suggest that Treasury traders are not currently factoring in a major recession. Of course they could change their minds very quickly with the next release of key data.
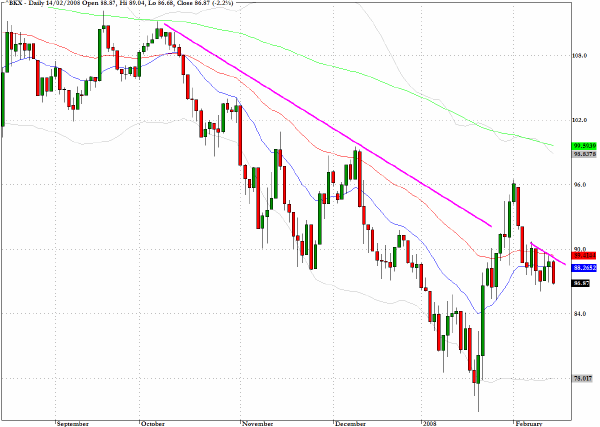
With the passing of time the chart for the banking index (^BKX) is revealing even more clearly the "false" breakout from late January.
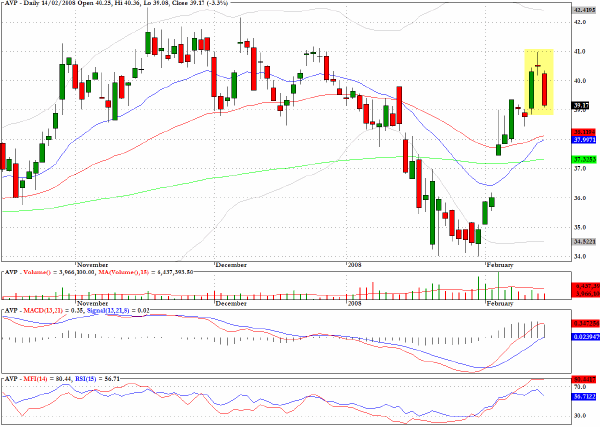
Avon Products (AVP) has a text book instance of the bearish Evening Star formation.
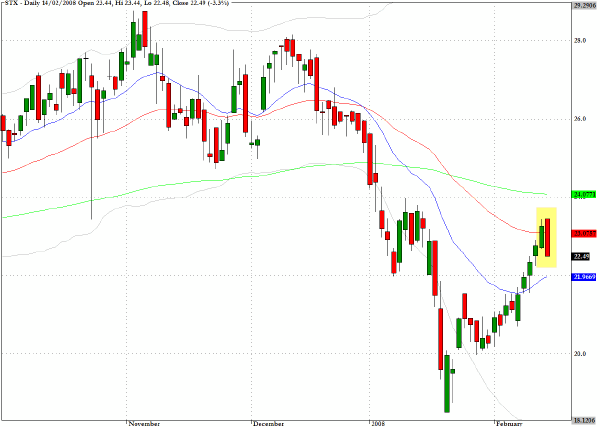
Seagate Technology (STX) ran into exactly the resistance discussed here yesterday.
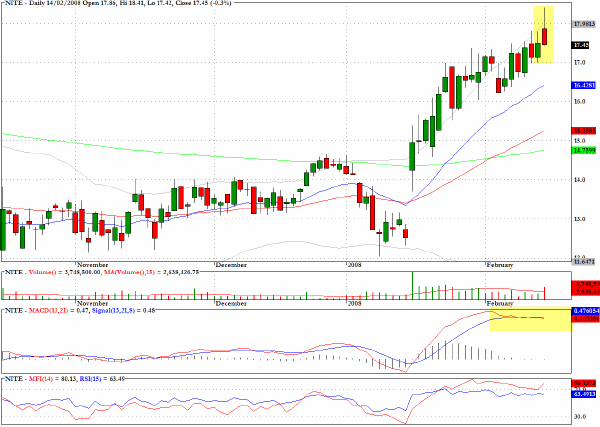
Knight Trading Group (NITE) produced a shooting star formation and is also showing momentum fatigue.
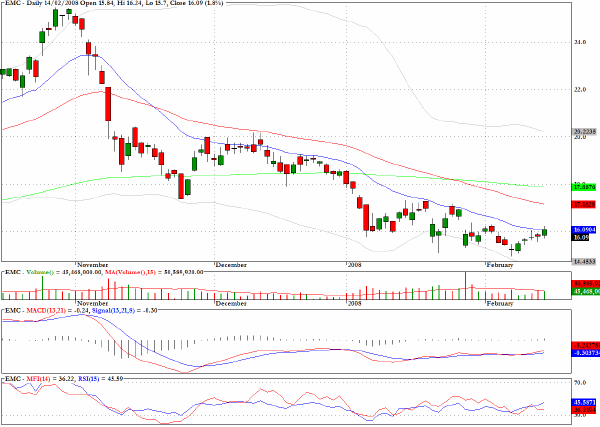
EMC looks constructive on the long side.
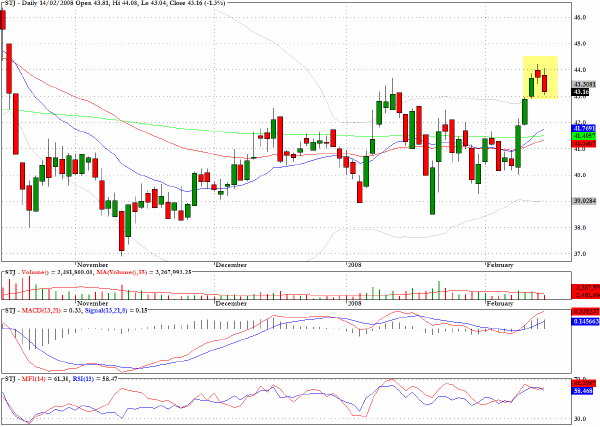
St Jude Medical (STJ) has another Evening Star pattern.
Clive Corcoran is the publisher of TradeWithForm.com, which provides daily analysis and commentary on the US stock market. He specializes in market neutral investing and and is currently working on a book about the benefits of trading with long/short strategies, which is scheduled for publication later this year.
Disclaimer
The purpose of this article is to offer you the chance to review the trading methodology, risk reduction strategies and portfolio construction techniques described at tradewithform.com. There is no guarantee that the trading strategies advocated will be profitable. Moreover, there is a risk that following these strategies will lead to loss of capital. Past results are no guarantee of future results. Trading stocks and CFD's can yield large rewards, but also has large potential risks. Trading with leverage can be especially risky. You should be fully aware of the risks of trading in the capital markets. You are strongly advised not to trade with capital.
|