| Weekly Outlook in the Stock Market |
| By Price Headley |
Published
02/18/2008
|
Stocks
|
Unrated
|
|
|
|
Weekly Outlook in the Stock Market
NASDAQ Composite
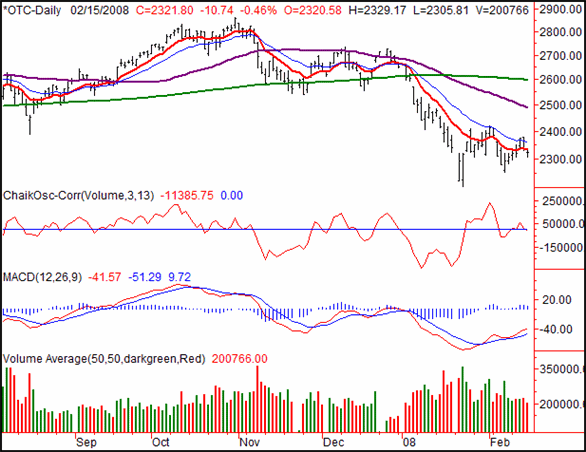
The NASDAQ closed at 2321.80 on Friday, falling 10.74 points (-0.46%). For the week, the composite still gained 0.74%, or 16.95 points. Despite the slight gain, the tone was more of a bearish one.
Though the composite closed under the 10-day average line (thick, red) - which is bearish in itself - the real trouble spot has been the 20-day line (thin, blue). We've seen two attempts to get back above it in the last three weeks, but neither worked. That said, since we want to plan for all scenarios, the 20-day average is currently at 2358, and falling slightly. If we can get and stay above that mark for a couple of days, the bulls have a shot at a short-term upswing.
As for the downside, well, we're already technically in a bearish mode - though barely. From here a move under the low of 2252 from two weeks ago could inspire more selling, while a move under the year's low of 2202 could be real trouble. We haven't gotten to that point yet though.
NASDAQ Composite Chart - Daily

S&P 500
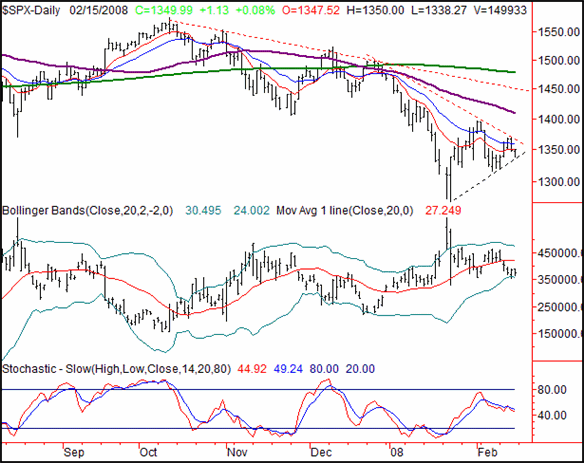
On Friday the S&P 500 managed to gain 1.13 points, or 0.08%. The close of 1349.99 was 18.70 points higher (+1.40%) than the prior Friday's close. Don't be fooled though; the bearish arguments here are stronger than the bullish ones.
We don't want to be repetitive if we don't have to be, so we'll point out something about the S&P 500 chart, and then discuss the same issue (the exact same issue) on the Dow's chart. It's the dashed lines: two red, and one black. We see a triangle shape here, which has ramifications for the SPX as well as for the Dow. Be sure to read below.
The only thing we need to add to the SPX analysis is the VIX. It finally hit its lower band on Thursday, and started to rise up off it on Friday. Taking that at face value means we're entering into a short-term pullback for the SPX. Granted, it was option expiration week, so we probably saw some skew. It doesn't matter though; we still have to burn the pressure of a low VIX off somehow.
The stochastic chart agrees; both lines are falling.
S&P 500 Chart - Daily

Dow Jones Industrial Average
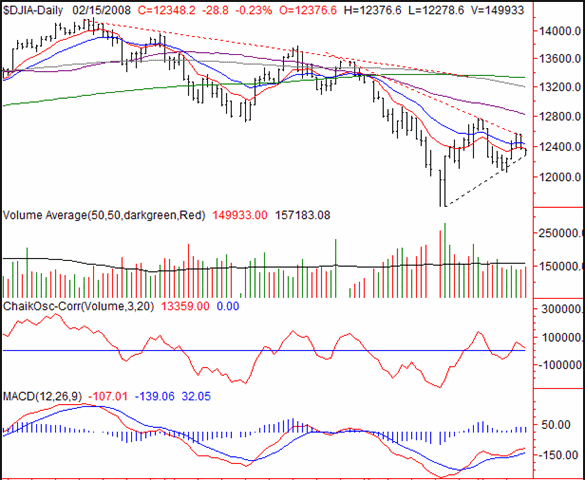
The 28.8 point loss (-0.23%) for the Dow on Friday left it at 12,348.2. On a weekly basis, that meant a gain of 166.1 points, or 1.36%. Just like the other indices, we see more bearish than bullish here.
If you look closely you can see the Dow closed under the 10-day moving average line (red, thin). Interpreted technically, that's bearish, even if we saw the index make a bullish push late in the day.
However, that's not the most interesting part of this chart. Take a look at the two red dashed lines and one black dashed line. The red are resistance lines, the second of which really didn't become apparent until this past week's peak. The black support line didn't appear until Friday.
This is a wedge, or triangle. It's not a super-critical one, as it's only been in place for a very short time. However, it does highlight the fact that traders and investors really aren't sure what to do. At this point, we're going to use the wedge as the bull/bear signal, since it largely coincides with a cross of the 10- and 20-day moving average lines.
We'll give you the specific levels for what it's worth: support is at 12,272, and resistance is at 12,507. However, both are sloped so steeply, they could be at quite different levels by Monday or Tuesday (and the wedge could have been broken by then).
Dow Jones Industrial Average Chart - Daily

Price Headley is the founder and chief analyst of BigTrends.com.
|