| Corcoran Technical Trading Patterns for February 19 |
| By Clive Corcoran |
Published
02/19/2008
|
Stocks
|
Unrated
|
|
|
|
Corcoran Technical Trading Patterns for February 19
Traders in the US returning from a long weekend may well be motivated on the long side in today's trading, following upbeat action across Europe on Monday, as well as a recovery in Hong Kong Tuesday morning which reversed Monday's weakness.
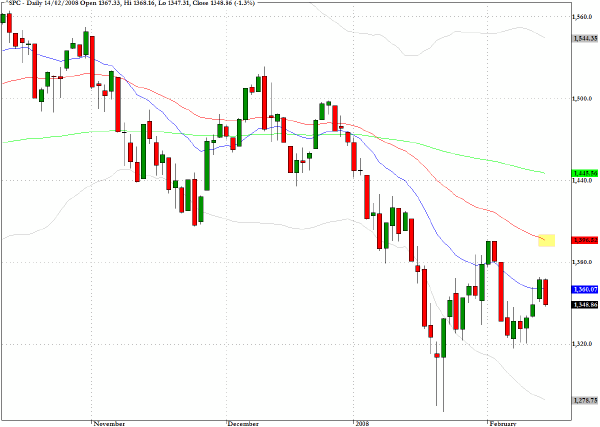
The S&P 500 (^SPC) could well see a rally up to the 50-day EMA in today's session although the more upbeat sentiment that began to appear towards the end of last week remains fragile. Several key releases of data during the course of the week will keep traders on their toes, but the background technical conditions are turning more favorable for an intermediate term rally.
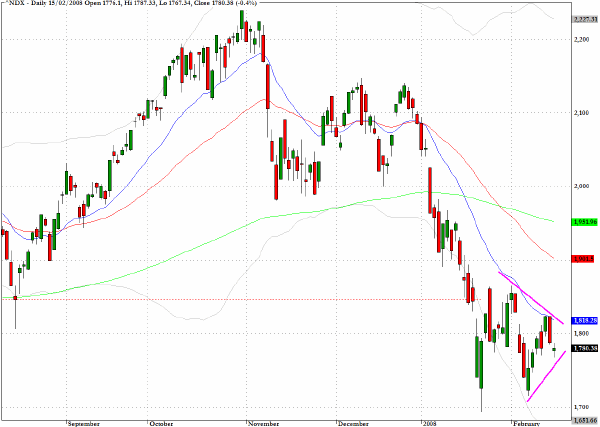
The Nasdaq 100 (^NDX) appears to be bracing for a test of the 1850 level again during this week. If, as is probable, this level is successfully pierced the next layer of resistance will be at the 1900 level.
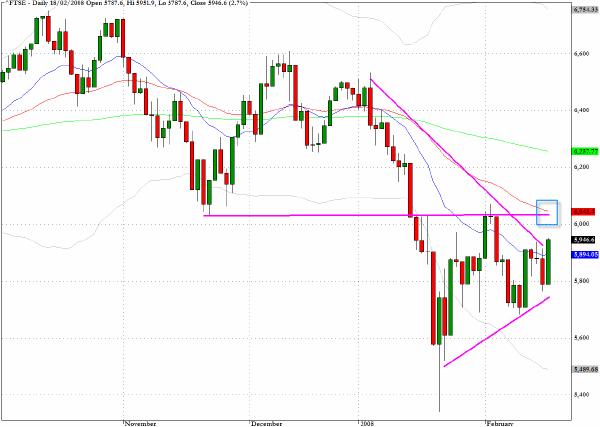
The FTSE in London had a strong showing in Monday's trading with a 2.7% rise that was partly fuelled by takeover activity and speculation in the mining sector; the UK's premier index is notably over-weighted in mining stocks. Also there was a healthy appetite for banking stocks which over-shadowed the development over last weekend in which the UK Government announced the nationalization of the troubled Northern Rock bank.
Despite months of trying, the government failed to find a private sector solution as not a single feasible bid emerged from all of the potential acquirers of the bank's assets - primarily a mortgage book worth more than $200 billion. UK taxpayers are now owners of the business and, in addition to underwriting the entire balance sheet of the bank, they now face the difficult task of foreclosing on mortgage defaulters and downsizing the banks retail branch operations.
The UK index will need to sustain yesterday's momentum in order to overcome strong resistance at the 6000 level which also coincides with the 50-day EMA.
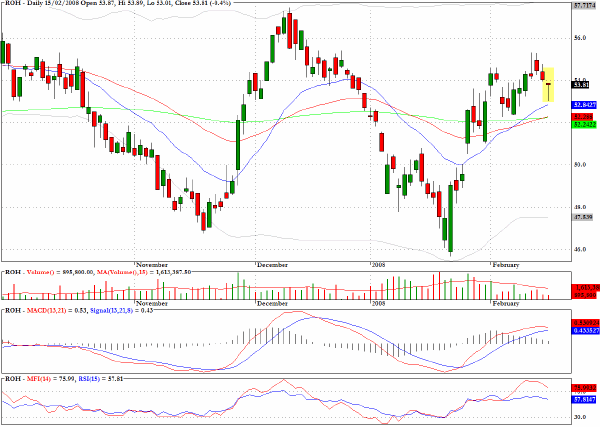
The chart for Rohm and Maas (ROH) reveals a long lower tail just above all three converging moving averages. The anemic volume during the last few days of price attrition suggests that the dynamics underlying the preceding pattern, which looks bullish, may be ready to re-assert themselves.
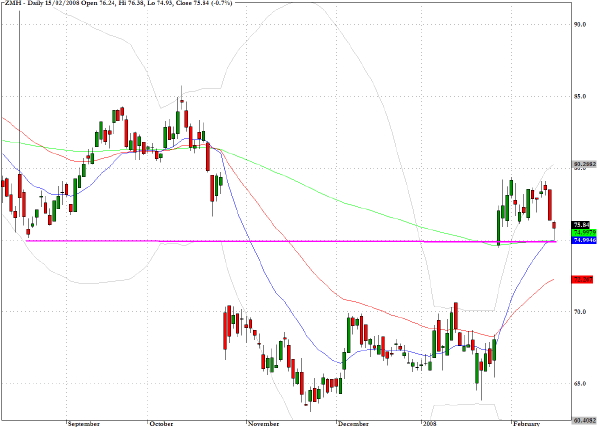
Zimmer Holdings (ZMH) also reveals a hammer with a long lower shadow at an area of potential chart support.
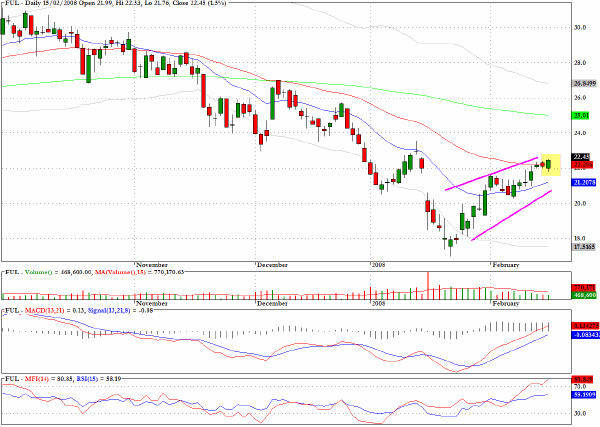
Fuller (FUL) has an ascending channel that appears to have reached overhead resistance and the recent declining volume suggests that a price relapse is probable.
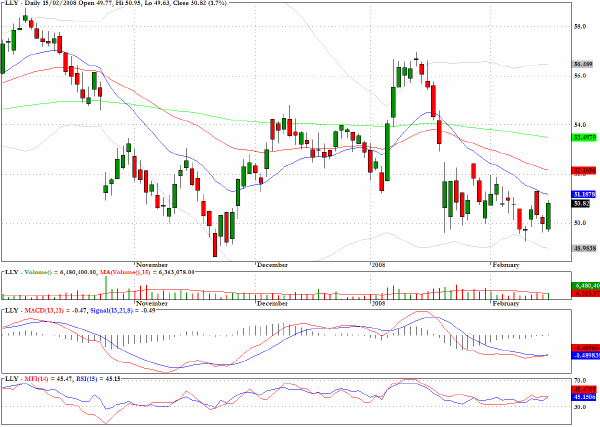
Eli Lilly (LLY) has a double bottom pattern with a slightly lower high. I would be targeting a move up towards $55 in the intermediate term.
Clive Corcoran is the publisher of TradeWithForm.com, which provides daily analysis and commentary on the US stock market. He specializes in market neutral investing and and is currently working on a book about the benefits of trading with long/short strategies, which is scheduled for publication later this year.
Disclaimer
The purpose of this article is to offer you the chance to review the trading methodology, risk reduction strategies and portfolio construction techniques described at tradewithform.com. There is no guarantee that the trading strategies advocated will be profitable. Moreover, there is a risk that following these strategies will lead to loss of capital. Past results are no guarantee of future results. Trading stocks and CFD's can yield large rewards, but also has large potential risks. Trading with leverage can be especially risky. You should be fully aware of the risks of trading in the capital markets. You are strongly advised not to trade with capital.
|