| The McMillan Options Strategist Weekly |
| By Lawrence G. McMillan |
Published
02/22/2008
|
Options
|
Unrated
|
|
|
|
The McMillan Options Strategist Weekly
The stock market has failed to respond to intermediate-term buy signals. It may still do so, but this is a bit of a worrisome fact. If this condition persists -- as it did in 2002 -- we plan to delve more deeply into the reason why (as we did at that time). Otherwise, if the market breaks out to the upside, as the indicators seem to indicate that it will, then we will not be overly concerned with a small mistake in timing.
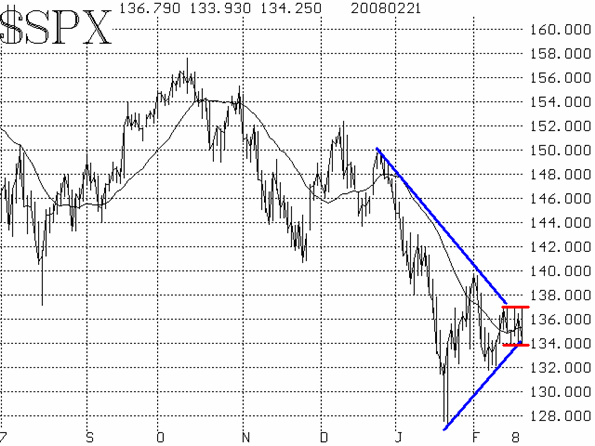
The chart of the S&P 500 ($SPX) has tightened down into a small range, at the end of another tightening formation -- a "wedge" of sort. All of this is within a large trading range. Even so, volatility remains high. Finally, all of this is taking place within a larger trading range, bounded by 1315-1320 on the downside and 1390-1400 on the upside. So, the market is range-bound. When it breaks out -- especially out of the latter range it should make a decisive move. But which way will it be? At this point, we favor the odds of an upside breakout, but nothing is certain in this continuing, nervous market.

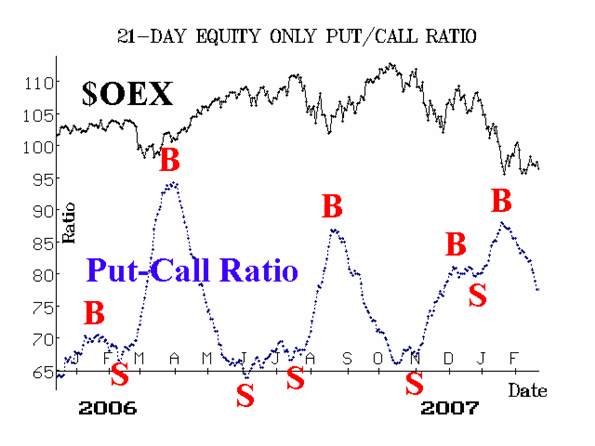
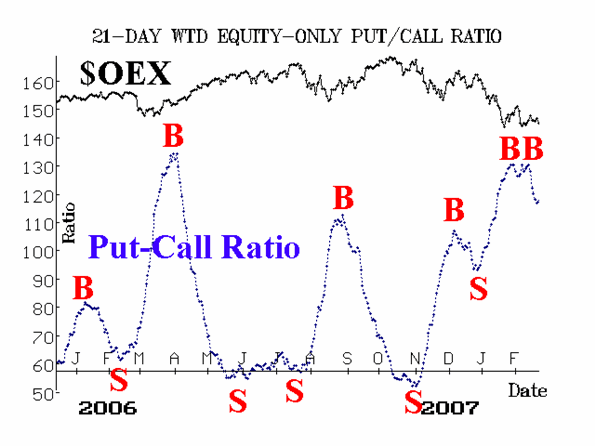
The equity-only put-call ratios are both on intermediate-term buy signals and that is one reason why we favor an upside breakout.

Market breadth (advances minus declines) has not been good, and breadth indicators remain on sell signals that they issued some time ago. This is our most negative indicator.

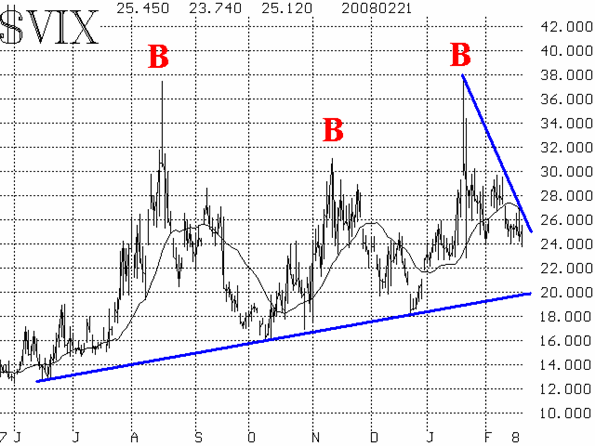
Finally, the volatility indices ($VIX and $VXO) have continued to decline, and thus their charts are bullish. As long as $VIX maintains its current downtrend, it is bullish. Moreover, the spike peak buy signal from $VIX, of an intermediate-term nature, remains in place. If $VIX were to close above 27, that would negate this positive signal.

In summary, put-call ratios and $VIX and positive. Breadth is negative, and $SPX is rather neutral, being constrained within several types of ranges. So, while the weight of this evidence is not overwhelming, it is bullish intermediate-term. However, we would respect an $SPX breakout, no matter which way it occurs.
Lawrence G. McMillan is the author of two best selling books on options, including Options as a Strategic Investment, recognized as essential resources for any serious option trader's library.
|