| Weekly Outlook in the Stock Market |
| By Price Headley |
Published
02/24/2008
|
Stocks
|
Unrated
|
|
|
|
Weekly Outlook in the Stock Market
NASDAQ Composite
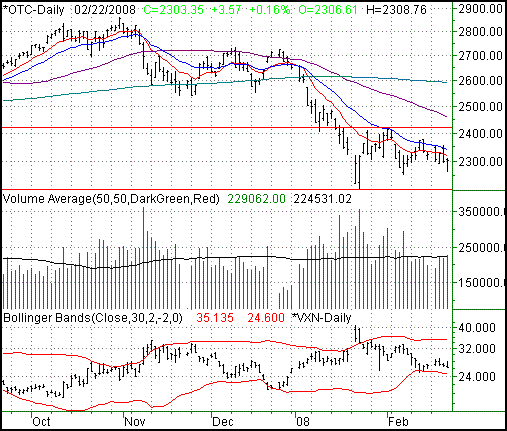
The NASDAQ turned what was going to be a loser into a 0.16% winner on Friday, up 3.57 points to close out at 2303.35. On a weekly basis that still meant an 18.45 point/-0.79% dip. The composite is also on the underside of all of the key moving averages. So, it's not like there's a lot of bullish hints here.
Just for the record, the NASDAQ closed right about where it did on January 18, so clearly this has been a very low-traction period. The two red, horizontal lines frame the tight range we've been in, 2202 to 2419 (at most).
The one thing we just can't shake is how well the 20-day line (blue) has been acting like a ceiling. For that matter, the 10-day average (red) has done the same a few times as well. We left off on Friday attacking the 10-day line, but haven't actually jumped it yet.
Based on the VXN - and the fact that it seems to be pressing lower - we do acknowledge there's some potential for bullishness. If the VXN can fall under last week's low of 24.88 actually drive the lower Bollinger band even lower (as opposed to bouncing off of it), and the composite can get above the 20-day line, then the odds tip in favor of the bulls. Until then, the odds remain in favor of more downside.
NASDAQ Composite Chart - Daily

S&P 500
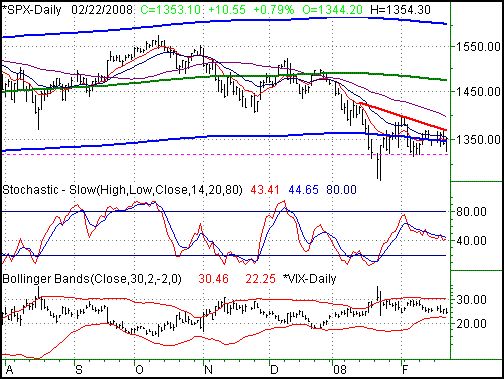
The big mid-day rebound for the market on Friday meant a 0.79% gain (+10.55 points) for the S&P 500. The close of 1353.10 was 3.10 points (+0.23%) above the prior Friday's close. It's with the SPX chart that the bulls can make their best argument.
The saga of the moving average envelope continues. For those of you who've been around the last couple of months, you'll recognize the thick blue lines above and below the index chart. If you're a newcomer, those lines are a +/- 8% 'envelope' around the 200-day line. The basic theory is that the market rarely exceeds that boundary. Instead, the odds favored a reversal back into the envelope, even if only temporarily.
As of Friday, we closed back inside (though barely) the envelope. Historically, this has hinted of a bigger upswing in the index, right up to the longer-term moving averages like the 50-day line (purple) or even the 200-day line (green).
In the meantime, the SPX pushed back above the 10-day average, and the 20-day line at 1356 is just a hair above where we are now.
Though we're not quite there yet, the odds for a bullish push here look good. The VIX is drifting lower, and its floor - the lower Bollinger band - is still a decent distance away at 22.25. And, the lower band line is now falling. That could buy some time for the bulls to get things going.
That said, our line in the sand is the resistance line (thick, red) currently at 1368, and falling. Above that, we're bullish. Anything else, we're hesitant. A move back under 1320, and we're back to a full bearish opinion.
S&P 500 Chart - Daily

Dow Jones Industrial Average
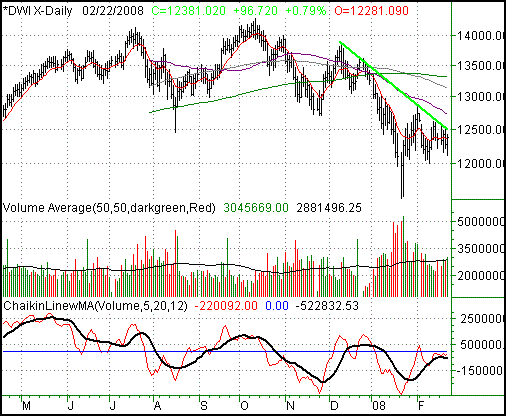
The Dow closed at 12,381.59 in Friday, up 0.79% - or +97.3 points - after spending most of the day in the red. That was just enough to push it into positive territory for the week, by 33.3 points, or 0.27%. Don't get too excited though; that wasn't enough to break the downtrend.
We went long with the other two indices, so we'll be brief here. Basically, any bullishness hinges on the Dow getting above that resistance line (bright green) at 12,515. Given the fact that the Dow's chart has stopped the bleeding and has even pressed upward, we can understand the bulls argument. As far as a strong trend goes though, the volume (via the Chaikin) line doesn't look all that impressive. The volume trend has been as flat and wafflish as the market has. So, we continue to wait for a break past resistance (or a break under 12,050).
Dow Jones Industrial Average Chart - Daily

Price Headley is the founder and chief analyst of BigTrends.com.
|