| The McMillan Options Strategist Weekly |
| By Lawrence G. McMillan |
Published
02/29/2008
|
Options
|
Unrated
|
|
|
|
The McMillan Options Strategist Weekly
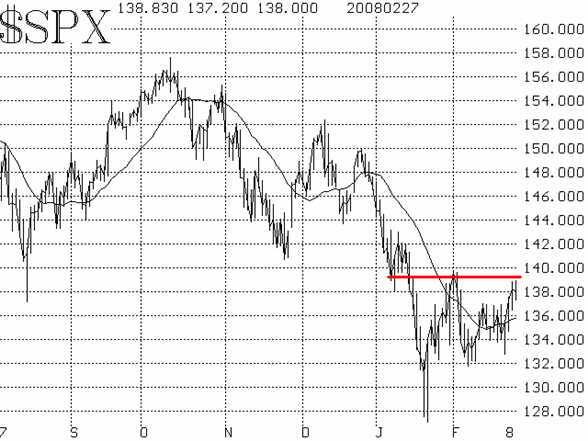
We still have some bullish indicators, but there are a few others that are weakening, so it's more of a mixed picture now. $SPX is right at the forefront of the battle. If it's not the primary predictor, it's at least the scorecard. $SPX was stuck in a rather narrow range between 1340 and 1370 for nearly two weeks. That didn't necessarily mean that there was no volatility, though: $SPX had daily ranges of over 20 points on every day in that period, and over 25 points on most days. Now that $SPX closed above 1370, we turn our gaze upward. There is resistance for $SPX at 1390-1400. A close above there would be very positive, and would probably mean that the current rally is going to extend for at least a few more weeks. A failure at that level, though, and we could easily be back downtesting support at 1325 in very short order.

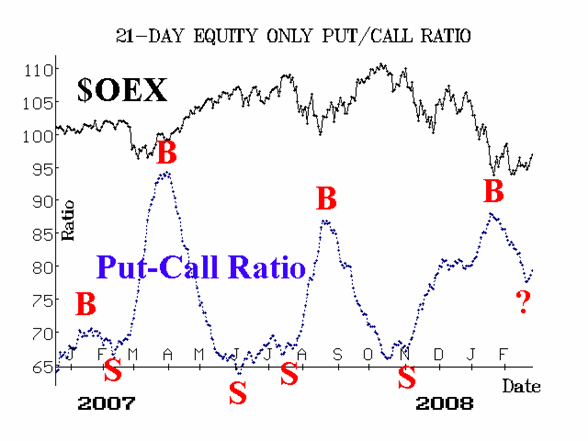
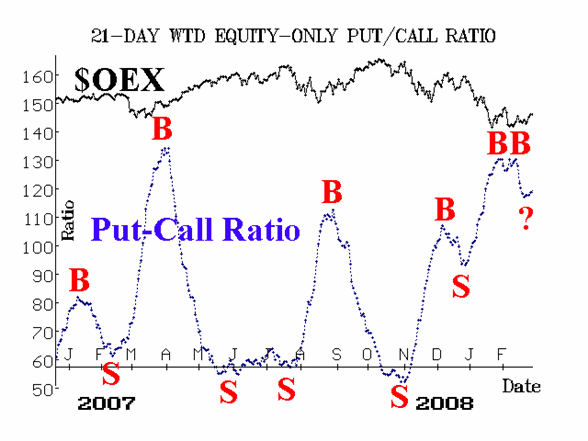
The equity-only put-call ratios have been correctly bullish, when the weighted ratio -- in early February -- finally confirmed the standard ratio's buy signal. With the upward movement this week, you'd think these reliable indicators would be turning even more bullish, but they haven't.

As you can see from Figures 2 and 3, both have developed a"wiggle" or slight "hook" on the far right hand side of their charts. At the present time, our computer analysis of these charts still says they're on buy signals. But if they truly roll over and begin to trend higher, then that would be a big negative for this market.

Market breadth (advances minus declines) has been a reasonably good predictor this year. So, the fact that breadth indicators are now overbought is worth noting. As our readers know, an overbought condition is not -- by itself -- negative. In fact, it shows that a lot of issues are participating in this week's rally. However, if breadth can't maintain itself at these strong levels, then it would be time to worry. Declines led advances by a slight amount today. If declines outnumber advances again Thursday, then a sell signal will have been issued. So it is imperative for the bullish case that breadth continues to expand.
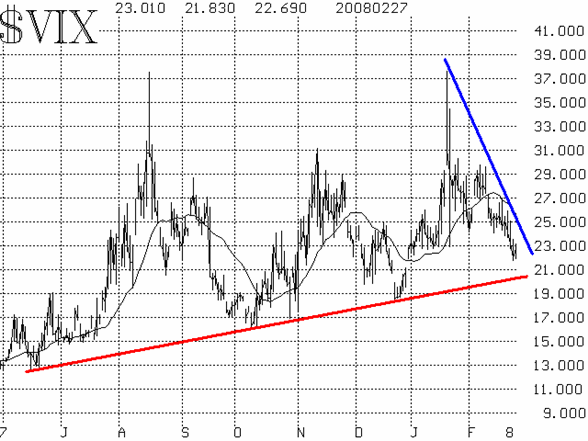
The volatility indices ($VIX and $VXO) have been decreasing steadily, and that is a bullish sign for the broad market. Ever since $VIX peaked near 30 in late January, it's been in a downtrend and the broad stock market has been in a less enthusiastic uptrend. As long as this condition persists, $VIX is a bullish intermediate-term indicator for the market.

So, we have mixed indicators. $SPX has broken out over resistance but is now encountering a potentially stronger resistance area. The equity-only put-call ratios are on buy signals, but the "hooks" at the ends of their charts might lead to sell signals. Breadth is positive now, but if it weakens, a sell signal will result. Only $VIX seems solidly bullish.
At this point, the best tack would be to lighten up with $SPX near the 1390-1400 resistance area. We can re-enter on the long side if $SPX breaks through there and continues on above 1400. Otherwise, we'll be glad we took some profits as the next correction unfolds.
Lawrence G. McMillan is the author of two best selling books on options, including Options as a Strategic Investment, recognized as essential resources for any serious option trader's library.
|