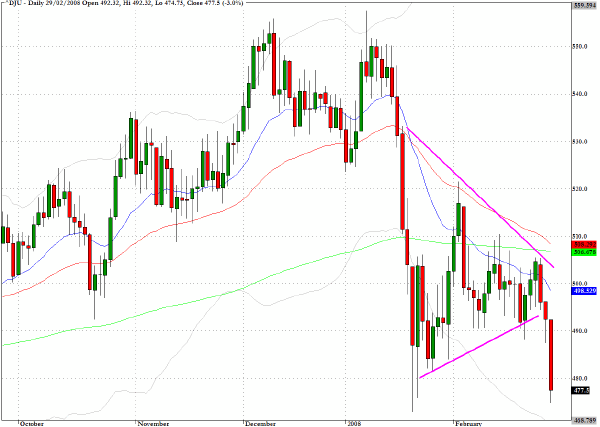
The utilities stocks were hit hard in Friday’s trading and the chart pattern for the Dow Jones Utilities index (^DJU) and the sector fund XLU reveal a clear break down from their respective triangular patterns.
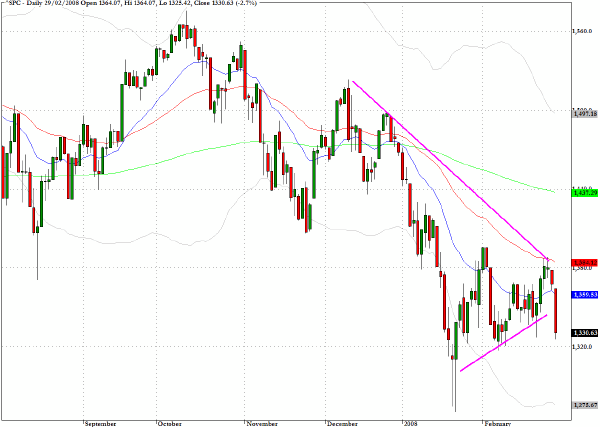
The erratic whipsaw action that has become pandemic during the last few weeks entered a more critical phase on Friday. After attempts early in the week to take the market up and beyond the striking triangular patterns found on most of the equity indices, the selling on Friday brought us down to levels where the lower range boundaries are now clearly threatened.
Friday's action reinforced the difficulties that I have been facing with the bullish argument, that despite (until Friday) the series of higher lows even when the market has had back to back up days the volume seems to be subdued, and suggests that upward progress is being made largely because the short sellers are sitting on the touchline. When the indices take a big tumble as they did on Friday the volume picks up suggesting not only that the short sellers are stepping up their activities but also that nervous, long only, portfolio managers are liquidating positions.
If long liquidations do not turn into panic selling then the zeal of the short sellers will inevitably lead to abrupt reversals but we are now facing a crucial test for the resolve of the bulls. The 1260-1280 level on the S&P 500 (^SPC) is a critical level and, in addition to marking the lows in January, there are several other technical patterns of long term chart support/resistance that suggest that this is a key level that needs to hold to prevent a rout. If fund managers do not see the level around 1260 as a value area in coming sessions then the pace of liquidations could really cause a breakdown and this would raise a much more ominously bearish shadow over near term direction. 
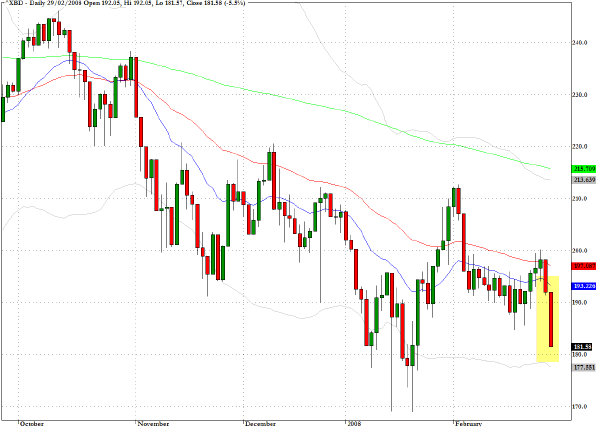
The broker/dealer index (^XBD) also points to even more pronounced under-performance than for the banking and financial services sector in general. Several of the investment banks are now approaching the bottom of ranges that have been in place since last August and I shall be watching Lehman Brothers (LEH), Bear Stearns (BSC) and Goldman Sachs (GS) with great interest this week as failure to hold at levels close to those registered last Friday, would be another serious blow for the bullish case. 
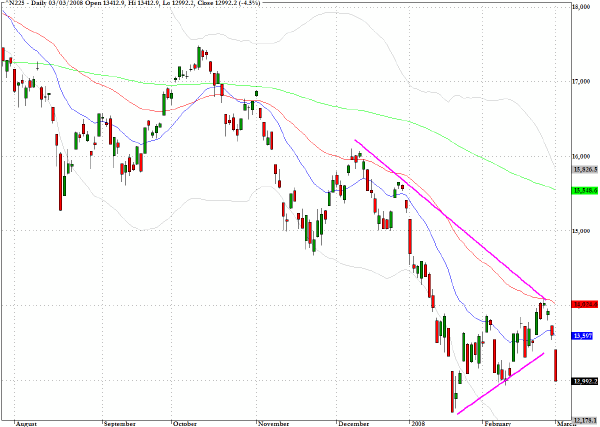
The Nikkei 225 (^N225) opened on its high and closed on its low in overnight trading as the index responded to Friday's weakness in the US with a 4.5% decline. Every time this index seems to be trying to build constructive chart patterns it runs into ugly reminders of further fall-out from the present fragility of the global credit system.
This index still seems to me to be vulnerable to a test of fundamental support in the region of 12000. 
The utilities stocks were hit hard in Friday’s trading and the chart pattern for the Dow Jones Utilities index (^DJU) and the sector fund XLU reveal a clear break down from their respective triangular patterns. 
Clive Corcoran is the publisher of TradeWithForm.com, which provides daily analysis and commentary on the US stock market. He specializes in market neutral investing and and is currently working on a book about the benefits of trading with long/short strategies, which is scheduled for publication later this year.
Disclaimer
The purpose of this article is to offer you the chance to review the trading methodology, risk reduction strategies and portfolio construction techniques described at tradewithform.com. There is no guarantee that the trading strategies advocated will be profitable. Moreover, there is a risk that following these strategies will lead to loss of capital. Past results are no guarantee of future results. Trading stocks and CFD's can yield large rewards, but also has large potential risks. Trading with leverage can be especially risky. You should be fully aware of the risks of trading in the capital markets. You are strongly advised not to trade with capital.