Richard Lee offers a preview of what to expect for Friday’s market moving release.
It’s time for non-farm payrolls. Here’s our preview of what to expect for Friday’s market moving release. After the first job loss in 4.5 years, the market is currently looking for the labor market to rebound modestly. We believe that this is overly optimistic, not only because most of the leading indicators for non-farm payrolls point to a weaker job growth, but because non-farm payrolls could realistically drop more than 100k in the month of February. The dollar has fallen to a record low today against the Euro which suggests that some traders may be pricing in the possibility of a weak number but Fed fund futures and economists have not. The degree of non-farm payroll growth last month will determine whether the dollar continues to see new record lows or if it will recover.
Why Could NFP Drop More than 100k?
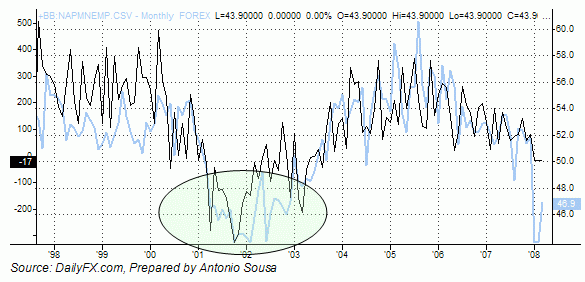
The main reason why non-farm payrolls could be very bad is because the last time service sector ISM contracted for 2 months in a row was back in late 2001. For those of you who remember, that was a particularly difficult time for the US economy. There was actually 15 consecutive months of job losses between 2001 and 2002 with -300k being the biggest monthly job loss during that period. Therefore a 100k drop does not seem unrealistic, especially since it pales in comparison to the average job loss between 2001 and 2002, which was -147k. Many people believe that the problems in the US economy today are far worse than in 2001 due to the triple blow of a housing crisis, credit crunch and skyrocketing commodity prices.
The following chart illustrates the strong correlation between the employment component of service sector ISM and non-farm payrolls. The last time, the employment component (blue line) was at current levels, job losses were 10 times larger than the drop in January. Any amount greater than -50k, spells big trouble for the US dollar. 
Another Decline in NFP Makes 75bp a Certainty
Last week comments from Federal Reserve Chairman Ben Bernanke have shifted the odds strongly in favor of a 75bp rate cut from the Federal Reserve. Today’s service sector ISM numbers have made the odds closer to fifty-fifty. However if non-farm payrolls drop for 2 months in a row, expect a 75bp rate cut to be a certainty. The Federal Reserve has not hesitated to tell the markets that they are not done easing and given the limited impact of their easing thus far, more needs to be done and done quickly. 
What is the market expecting for February NFP?
Change in Non-Farm Payrolls: 25k Forecast, -17k Previous
Unemployment Rate: 5.0% Forecast, 4.9% Previous
Change in Manufacturing Payrolls: -25k Forecast, -28k Previous
Average Hourly Earnings: 3.6% Forecast, 3.7% Previous
Average Weekly Hours: 33.7 Forecast, 33.7 Previous
In order to determine the strength of non-farm payrolls, we typically look at 10 pieces of data that we call the leading indicators for non-farm payrolls. The Hudson Employment Index is no longer being released which is why we are down to 9. According to the numbers that have already been released, two thirds of the leading indicators point to a weaker employment report. Both the employment components of service and manufacturing ISM point to a contraction. Help wanted ads drop in the month of February while consumer confidence declines to multi-year lows. Even the ADP employment survey which over estimated payroll growth last month fell for the first time in 4 years. Although the data overwhelming supports a weaker number, there are also arguments in favor of stronger one. This includes a drop in the 2 week average of jobless claims, a decline in strike activity and layoffs falling 14 percent in the month of February. Of the 76 economists surveyed by Bloomberg, the most optimistic forecast is by Westpac who calls for 70k job growth. The most pessimistic is Dresdner Kleinwort who is calling for job loss of -110k. There are actually a handful of economists forecasting another month of job losses.
Arguments for Weaker Non-Farm Payrolls Growth
1. ADP Report Falls By 23K - First Negative Reading Since June 2003
2. Help Wanted Index Falls to 21 in February
3. Consumer Confidence Declines to Multi-Year Lows According to UMich, Conference Board
4. ISM Manufacturing Employment Components Continue to Signal Contraction
5. ISM Services Employment Components Continue to Signal Contraction
6. 4 Week Average of Continuing Claims Tick Higher
Glancing at the US labor market data for the month of February, it is rather clear that the odds are in favor of a weak non-farm payroll reading this Friday. The ADP employment report unexpectedly showed its first negative reading since June 2003, while the Help Wanted Index eased to 21 from 22 and the 4-week average of continuing claims ticked up to 2.78 million from 2.75 million, signaling that demand for new hires is weak. This softness is apparent in both the manufacturing and services sector, as surveys conducted by ISM indicate a contraction in hiring for both. Indeed, the employment component for ISM manufacturing eased to 46.0, marking the fourth consecutive month that the figure held below the 50 boom/bust level. While the same component for ISM services improved slightly to 46.9, this still marked the second reading in a row below the critical 50 level. Furthermore, consumers aren’t taking kindly to the weakening labor market conditions, as sentiment continues to wane and signals that spending may have much further to fall. During the month of February, the University of Michigan consumer confidence survey plunged to a 17-year low of 70.8 from 78.4 while the Conference Board’s measure dipped down to a 5-year low of 75.0 from 87.3.
Arguments for Stronger Non-Farm Payrolls Growth
1. 4 Week Average of Jobless Claims Falls to 360.5K from 361.75K
2. Strike Activity Fell to 2,500 in February, Down from 4,000
3. Challenger Job Cuts Down 14.2% In February
As we have said, most of the evidence regarding the labor markets during the month of February points towards a weak non-farm payroll reading, but there is a chance that the figures may not be as bad as expected. The 4-week average of jobless claims eased back to 360.5K from 361.75K at the end of the month – though this is still near the highest levels since October 2005 – while the Labor Department said that strike activity (involving at least 1K workers) fell to 2.5K from 4K in January. More encouraging was the drop in planned job cuts, as Challenger, Gray & Christmas, Inc. indicated a 14.2 percent drop from a year earlier. However, it is worth noting that major components of the services sector (consumer goods, food, and entertainment) all showed a jump in layoffs, while government/non-profit agencies showed an even greater surge.
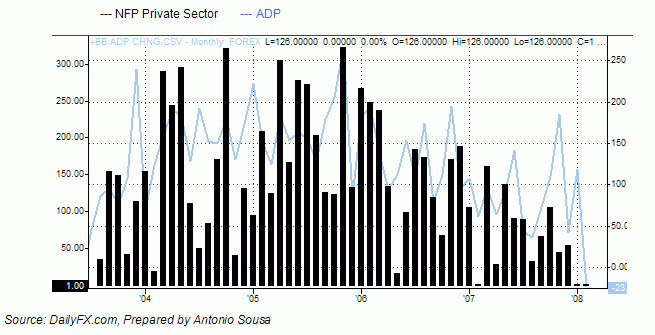
The following charts compare the monthly releases of ADP with private sector payrolls and total non-farm payrolls. Generally speaking, the two releases are correlated, but as with everything, the correlation is not perfect. Last month was the perfect example when ADP reported private sector payroll growth of 130K, but as we all know, there was actually a net job loss. Therefore even though ADP reported a payroll contraction of 23K in the month of February, we cannot rely on it exclusively. 
Examining the Leading Indicators for Non-Farm Payrolls
With the market divided on what will happen next to the US economy, we believe that job growth of any size should help the US dollar recover while job losses of any size should push the US dollar to fresh record lows. Either way, Friday’s non-farm payrolls report should have a big impact on the currency, stock and bond markets. As usual, also watch for revisions to the January figure because it can easily exacerbate or negate the changes to the current month’s headline number.
Richard Lee is a Currency Strategist at FXCM.