| Corcoran Technical Trading Patterns for March 6 |
| By Clive Corcoran |
Published
03/6/2008
|
Stocks
|
Unrated
|
|
|
|
Corcoran Technical Trading Patterns for March 6
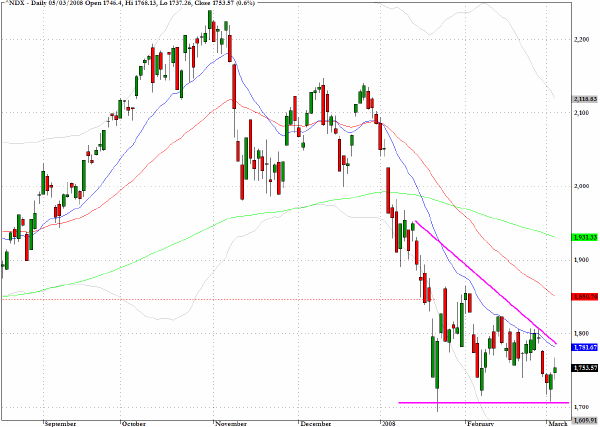
The Nasdaq 100 (^NDX) confronts, along with many indices, the fact that it is being pushed towards a critical point within a descending wedge pattern.
What is remarkable is how during the last three weeks the dominant pattern for many global equity indices has morphed from a triangle or pennant into downward wedge patterns. Interestingly in the case of the Nasdaq 100 the 20-day EMA has more or less defined the key descending trendline and, as I have previously intimated, the pattern could be the technical precursor to a serious sell-off. Several credit market related developments or weak data could provide the trigger, including tomorrow's employment report. Chairman Bernanke may have to convene another emergency meeting if the market doesn't like what it sees in the data.
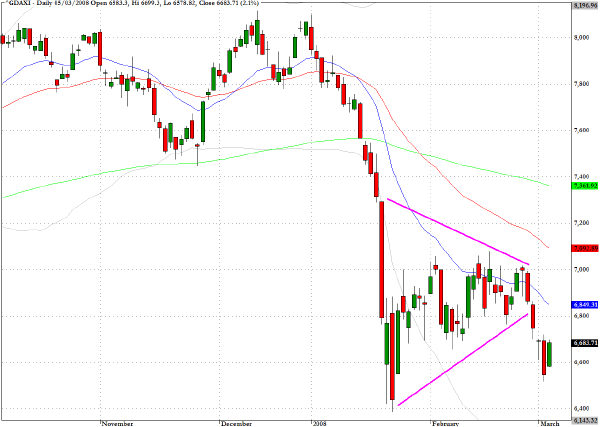
Germany's DAX index broke down from the well-defined triangular pattern and is now hovering above its January low. With the ECB unlikely to be as friendly to the markets as the Fed has been, the index could be on the threshold of a critical retest of the January low.
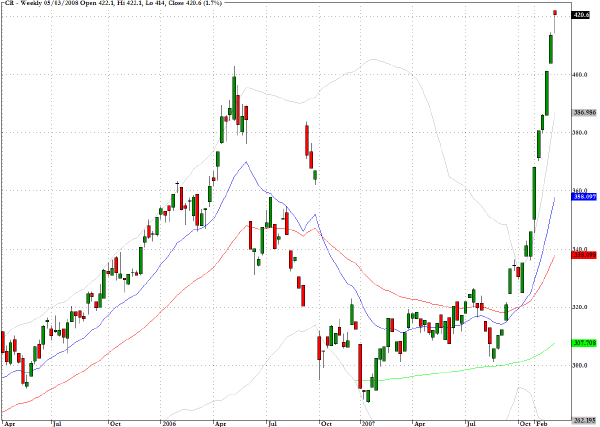
A weekly continuous chart of the CRB/Bridge Index futures contracts highlights the problems that are confronting all central bankers.
The Bank of England wants to reduce rates but has been spooked by recent inflation data in the UK and, as this is being finalized, has decided to leave rates on hold. While the Federal Reserve expresses concerns about inflation, its larger imperative (especially in an election year) will be to rescue equity markets to the extent that it can.
I intend to discuss the rampant bull market in many commodities during my guest slot on CNBC's European Closing Bell at around 16:30 London time today.
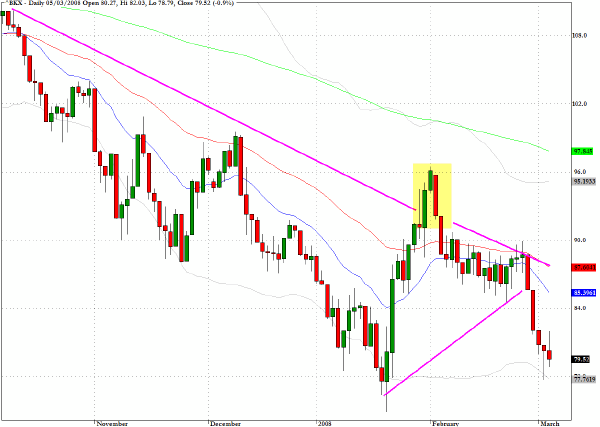
On January 18 The banking index (^BKX) registered its lowest close since early 2003 but this was soon followed by an abrupt change of direction that took the index back above lines of resistance. With the benefit of hindsight we now see clearly the false breakout and the steady decline ever since. The index is now about to confront those January lows again and the chart pattern is not encouraging.
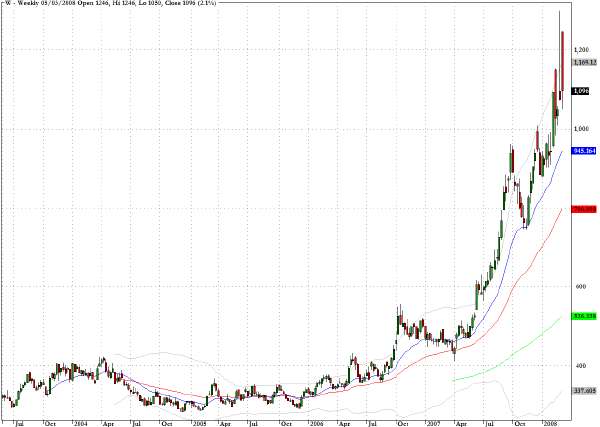
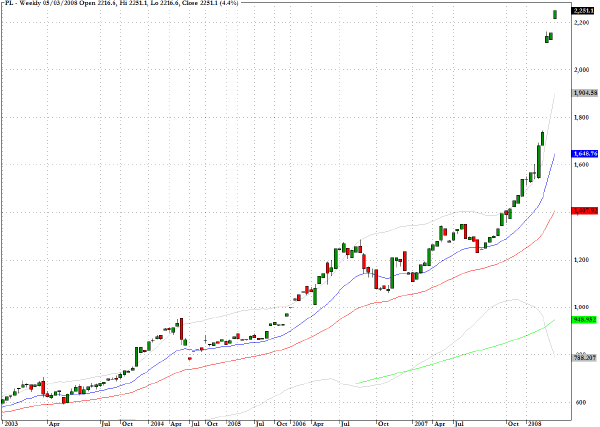
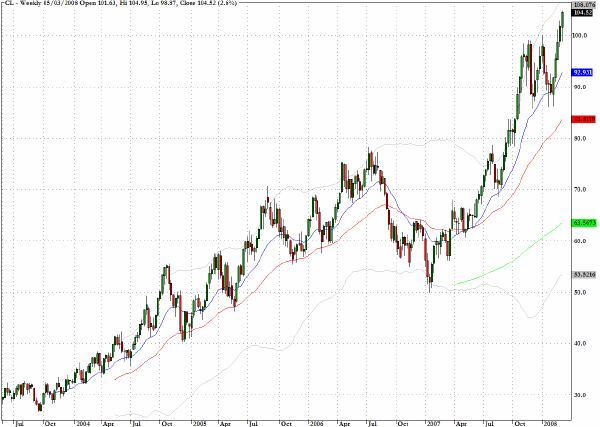
I do not intend to provide any technical analysis on the next few charts but have included them as visually arresting images explaining why central bankers are so concerned about inflation.
The continuous weekly chart for Wheat futures shows the alarming trajectory which is contributing to large food price increases across the globe.
My favorite chart at the moment is the weekly continuous futures chart for platinum which I had to check to make sure that I had not received bad data from my quote supplier.
As both a precious metal and an industrial metal with consequential inflationary implications, this chart shows how much fun some hedge fund managers are having.
The chart for crude oil (CL) also suggests that this vital industrial commodity is also becoming a have for hot money.
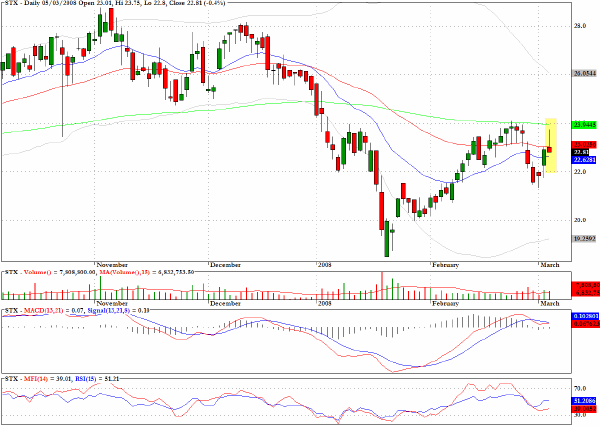
After running into resistance at its 200-day EMA, Seagate Technology (STX) succumbed to the expected selling pressure and after a minor pullback the shooting star formation from yesterday suggests that further selling may be imminent.
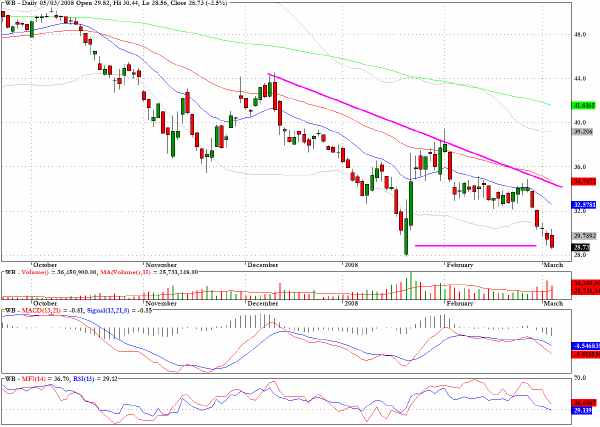
Wachovia Bank (WB) also illustrates the descending wedge pattern that I keep mentioning and in yesterday's trading a new multi-year low was registered.
Clive Corcoran is the publisher of TradeWithForm.com, which provides daily analysis and commentary on the US stock market. He specializes in market neutral investing and and is currently working on a book about the benefits of trading with long/short strategies, which is scheduled for publication later this year.
Disclaimer
The purpose of this article is to offer you the chance to review the trading methodology, risk reduction strategies and portfolio construction techniques described at tradewithform.com. There is no guarantee that the trading strategies advocated will be profitable. Moreover, there is a risk that following these strategies will lead to loss of capital. Past results are no guarantee of future results. Trading stocks and CFD's can yield large rewards, but also has large potential risks. Trading with leverage can be especially risky. You should be fully aware of the risks of trading in the capital markets. You are strongly advised not to trade with capital.
|