| A Mid-Week Look at the Market |
| By Price Headley |
Published
03/6/2008
|
Stocks
|
Unrated
|
|
|
|
A Mid-Week Look at the Market
NASDAQ Composite
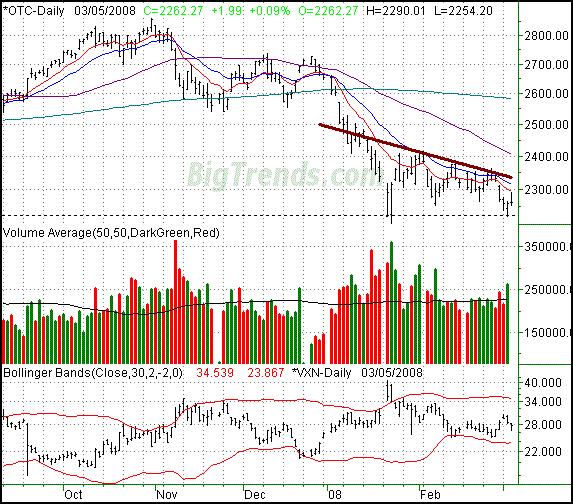
There's one thing Tuesday's low did for us: define support at 2221. That was the low from January 22. We actually traded a little bit under that mark on the 23rd, but the low close (up until that point) was from the 22nd. Though we seem to have bounced off that line again yesterday/today, it's still very much on the radar.
In fact, the reason why the support line (dashed) means so much right now is because the resistance lines are keeping any rally staved off. The 10- and 20-day lines (red and blue) are capping most rally efforts. The end result has been the formation of a significant resistance line (maroon) at 2335, and falling.
From here, the only two things we're really worrying about are those two levels. The race is on; whichever one breaks first will guide the next major move.
Most technical analysts would see the wedge/triangle - along with its situation (previously falling) - and suggest bearishness was likely. We wouldn't disagree. The problem is, we're seeing wild breadth and depth that says the short-term bottom has already been made. To burn off that oversold condition we'd need to rally fore a while...rally well past that short-term resistance line.
We're bearish in the intermediate-term no matter what; the question is just one of the path between here and there.
NASDAQ Composite - Daily

Since we really can't answer the short-term question just yet, let's look at the long-term chart for some perspective on why we can't answer it.
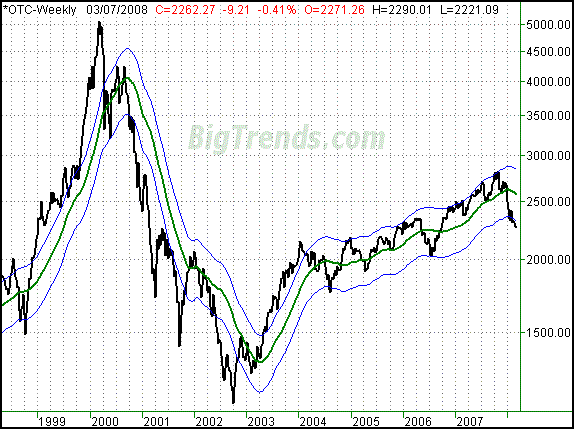
Remember the discussion we had about the market's limit on how far it could remove itself from its long-term average before getting reeled in again? The general finding was that once we saw an index get about 8% above or below its 200-day line, then one of two things happened: it either reverted back to the mean (retested the 200-day line), or really pulled away - perhaps like a planet suddenly free of the sun's gravity.
We've seen two major rebounds following the limit-test for the NASDAQ since 2004. We're in the third one, and as you'll see, so far the 8% boundary hasn't meant a recovery.
On the chart, the green line is a 200-day line, and the two blue lines are an +/-8% envelope. We're well under that lower envelope line now, which reminds us of the period between 2000 and 2002 when the boundary failed completely, and the market just sank like a rock.
NASDAQ Composite - Weekly, with 8%(+/-) envelope

To undo this damage (at lest in the short run), the composite will have to get back inside the envelope by crossing back above that lower envelope line. It's at 2320 right now. Though not exactly, that's basically where the key resistance line (form the daily) will be by the time the index is in a feasible position to actually break through it.
Again this doesn't really answer the question. However, the size of the potential move in either direction is an exciting prospect. The trick is remaining patient.
S&P 500
Since we went pretty long with the NASDAQ chat, we'll be brief with our highlights of the SPX chart. Basically, we see two issues for the bulls here.
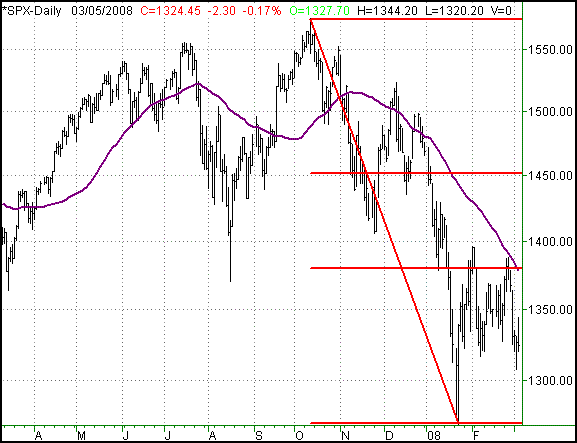
The first one is resistance at the 50-day moving average line. It's been support as well as resistance several times in the last few months, most recently resistance with the rally from early February. That level will have to be surpassed first before the bulls have a shot at a decent move.
The second ceiling is rooted in the Fibonacci lines; 1380 is a 38.2% retracement of the span from the peak to the trough. We've pushed above it a couple of times in the last month or so, but can't get there and stay there.
Getting past both marks will be the only convoking bullish argument here.
S&P 500 - Daily

Price Headley is the founder and chief analyst of BigTrends.com.
|