| The McMillan Options Strategist Weekly |
| By Lawrence G. McMillan |
Published
03/7/2008
|
Options
|
Unrated
|
|
|
|
The McMillan Options Strategist Weekly
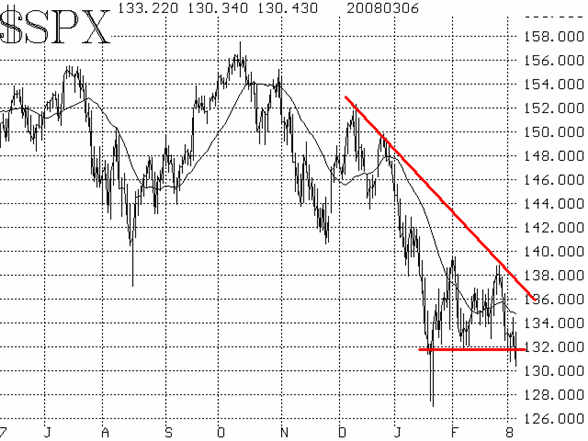
Late last week, $SPX fell after hitting 1390-1400, leaving that area as solid resistance. It then dropped to the 1320 area and bounced a few times, but eventually (on Thursday) that level gave way. Heavy selling developed when it did, and $SPX closed at the lowest price since it was on its way up in September 2006. From the $SPX peak in October (yes, Virginia, the all-time high was made in October -- after the first warning shots about subprime problems had been "fired" in August) to Thursday's close is a decline of 17%. In short, the $SPX chart continues to be negative.

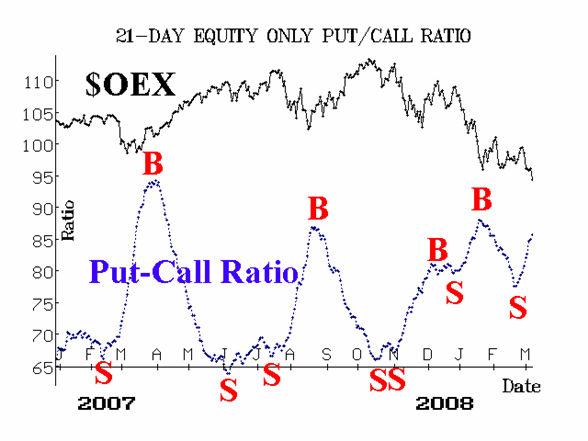
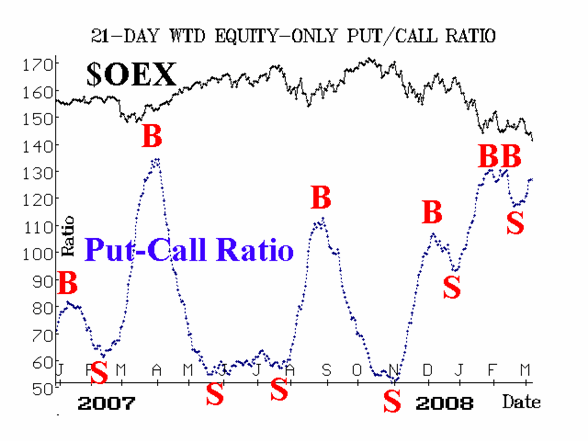
The equity-only put-call ratios rolled over to sell signals -- a condition we warned about in last week's newsletter. The actual rollover to sell signals came after last Friday's broad market decline.This is unusual for these intermediate-term indicators to reverse course so high on their charts, but they were correct to do so. Now, one must wait for new buy signals to set up, and that won't be easy. About the only positive thing that one might say about these ratios is that they are high on their charts, and as such, qualify as being "oversold." However, as we've often said, "oversold does not mean buy. Some of the worse declines come when the market is oversold."

Market breadth (advances minus declines) has been quite negative this week, after generating sell signals at the close of trading last Thursday (February 28). After today's decline, breadth is in official oversold territory. Keeping the above caveat in mind about oversold markets, we will be watching for it to roll over to a buy signal, for it has been a well-timed indicator in the last few months. That rollover to a buy signal will only come after advances lead declines for a couple of days -- something that seems only remotely possible after watching Thursday's slaughter.

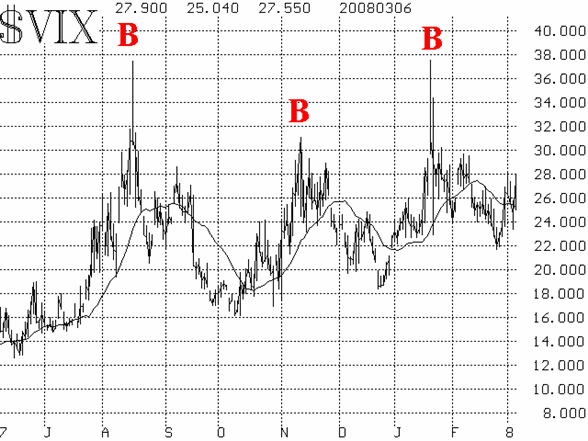
Finally, the volatility indices ($VIX and $VXO) have been rather subdued. This is another area where one would expect to see capitulation, but once again it has not been forthcoming. $VIX has moved up towards 28 and that broke the bullish downtrend that had been existent in $VIX. However, with the broad stock market selling off heavily, one would expect to see $VIX well above 28. The two major capitulations -- last August and last January -- came as $VIXspiked up to 38, intraday. Something on that order will likely have to happen again before a true spike peak, intermediate-term buy signal is generated by $VIX. Lacking that, as long as $VIX continues to crawl upward, that is bearish for the stock market.

So, here we are again, entering a major oversold condition in a sharply declining market. The $SPX chart is negative; put-call ratios remain on sell signals; breadth is still on a sell signal, too; and $VIX hasn't gotten desperate, as it likely needs to before a bottom is in place. You know the drill by now: we remain bearish, but expect that sharp, but short-lived rallies could spring up at any time.
Lawrence G. McMillan is the author of two best selling books on options, including Options as a Strategic Investment, recognized as essential resources for any serious option trader's library.
|