| Weekly Outlook in the Stock Market |
| By Price Headley |
Published
03/10/2008
|
Stocks
|
Unrated
|
|
|
|
Weekly Outlook in the Stock Market
NASDAQ Composite
Friday's 8.01 point loss (-0.36%) for the NASDAQ Composite left it at 2212.49. That was 2.6% below the previous week's close -- a 58.99 point dip. More than that, the composite is teetering on the edge of new lows for the year - a potential powder keg of bearishness.
One of the chief complaints we've had for the last six weeks was how the NASDSAQ had been trapped in a range, or specifically, a wedge (framed with red dashed lines on the chart below). The wedge complaint no longer stands. It was broken this week.
The last bastion of rebound hope lies at the January 23 low of 2202.54. However, Friday's low of 2186.93 even puts that into question.
Taking it all at face value, we have to side with the bears at this point, unless the bulls can pull out a small miracle in the coming week. Keep in mind the breakdown may not happen on Monday. The bulls might fight back briefly, but as long as the 10- or 20-day averages (at 2269 and 2298) hold up as a ceiling, the bears should eventually win the current war. We already have a MACD cross-under.
NASDAQ Composite Chart - Daily

S&P 500
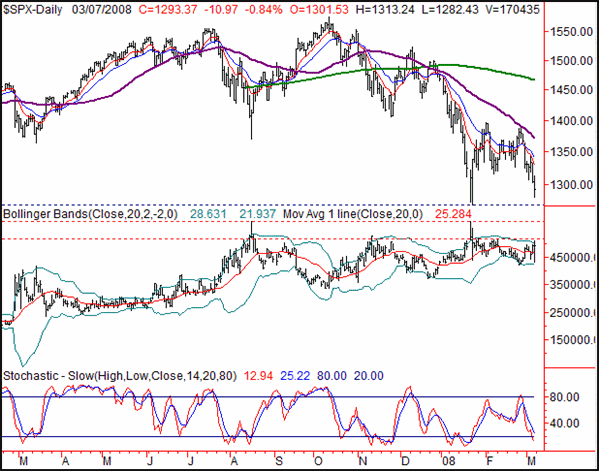
The 10.97 point/-0.84% tumble for the S&P 500 on Friday left the large cap index at 1293.37 for the week. That dip translated into a weekly loss of 37.26 points, or -2.8%. And, like the NASDAQ, the SPX is knocking on the doors of new lows for the year, with some momentum behind it.
The SPX's line in the sand is the January 23rd low of 1270.64. We only saw a low of 1282.43 on Friday, so we have a little breathing room here.
On the bullish side of the fence we have the fact that we're stochastically oversold. That doesn't mean we should expect a bounce. We can get oversold and stay oversold for long periods of time. It just means that we're ripe for a bounce if traders are so inclined.
The piece of the chart we want to focus on here is the VIX. We saw a huge span on Friday (22.29 to 29.29), which somewhat trumps any meaningful interpretation we were trying to make about whether it would bounce off the upper Bollinger band. It did, but it also bounced off the lower band. However, one thing we have noticed about the VIX lately is the 37.50 area has been the peak point where stocks also made a strong bottom. There's a secondary ceiling around 30.0, which is much closer to the VIX's close of 25.28 on Friday, but this may or may not be a reversal point. Bottom line is the VIX says we probably have more downside to go before making a good bottom.
S&P 500 Chart - Daily

Dow Jones Industrials
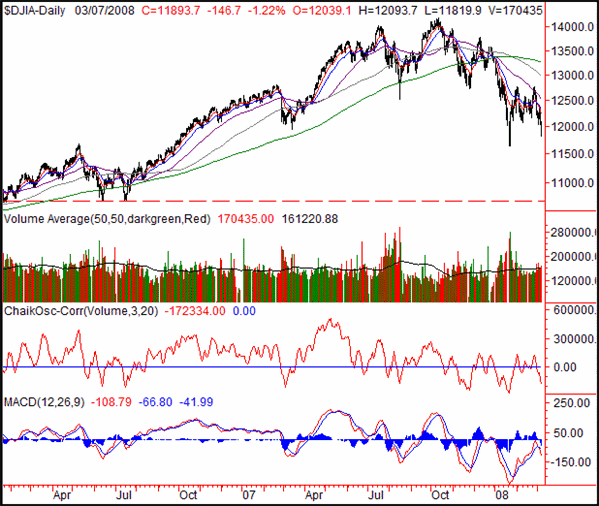
The Doe fell 140.7 points on Friday, or -1.17%. The close at 11,899.69 was 2.99% below the prior Friday's closing level -- a loss of 366.7 points. Most signs point to more downside for this chart.
Nothing new or significant to add here that we haven't already said. The Dow's trading range over the last several weeks is starting to break down on the bearish side of the fence. The selling volume has picked up too for real concern.
By the way, if the Dow falls under January's low of 11,640, it could be real trouble. The next nearest proven support level is the 2006 low around 10,700. It's marked with a red, dashed line.
Dow Jones Industrials Chart - Daily

Price Headley is the founder and chief analyst of BigTrends.com.
|