Lawrence G. McMillan reviews the options market in his weekly column for March 14.
This has certainly been an interesting market, to say the least. With wide swings and plenty of volatility, it trades -- as the old saying goes, "at everyone's price." Of course, to have the fortitude to stick it ou tuntil it trades at your price can be quite the challenge. 
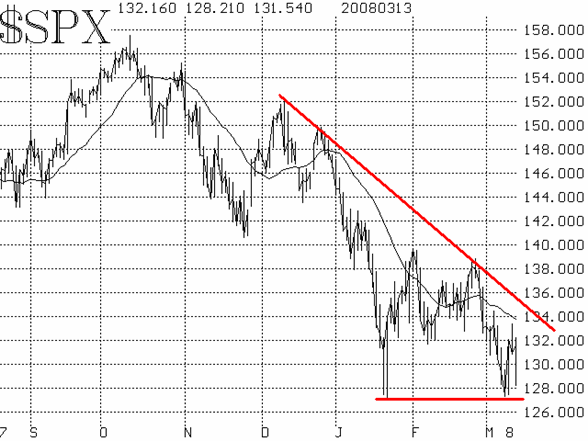
The $SPX chart is always important. At this point, it appears that the test of the 1265 level was successful (at least so far), and a bounce is underway. However, the rally had trouble at the $SPX resistance near 1320-1330 over each of the last three days. The longer that resistance builds up, the more significant it is. Even if $SPX should overcome that level, there is still plenty more resistance, all the way up to 1390-1400. In other words, the $SPX chart is currently bearish. 
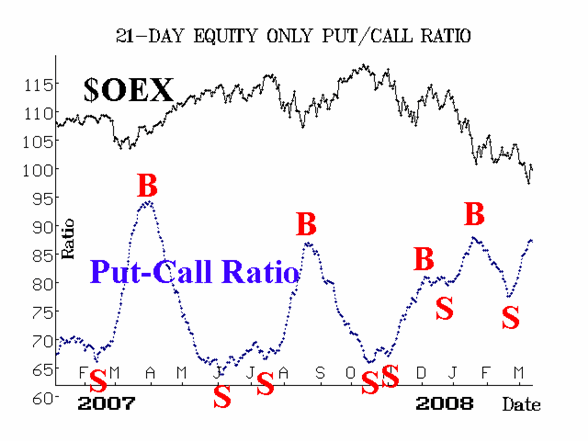
The Equity-only put-call ratios continue to rise and thus remain on sell signals. While they are high on their charts, that merely means they're in an "oversold" state. They must roll over and begin to trend downward in order for buy signals to be confirmed. At this point, they haven't done that. 
Breadth (advances minus declines) remains negative. Despite this rally, which has persisted for parts of three days, breadth remains oversold. Apparently, it's going to take another day or two of positive breadth to generate a buy signal. The fact that breadth has been rather poor on this rally is not a good sign. At this time, breadth remains negative.
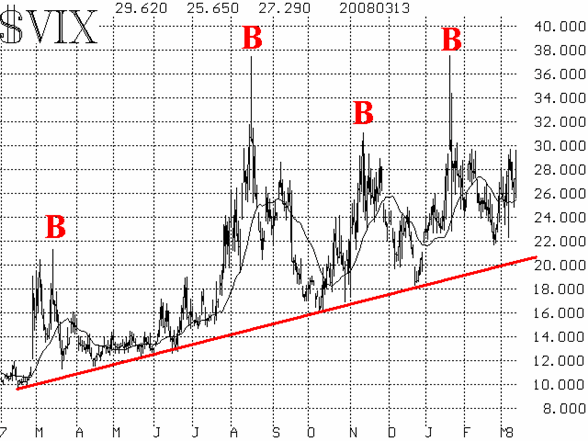
Volatility indices ($VIX and $VXO) have advanced during the decline over the past few weeks, but almost reluctantly. They haven't spiked up in a capitulation panic where traders just buy puts at any price. Rather, $VIX has advanced calmly and rather slowly. This, too, is not particularly good. Usually an intermediate-term bottom is only forthcoming when $VIX makes a true spike peak. 
In summary, this is not a positive set of technical indicators. $SPX hasn't been able to penetrate resistance, the put-call ratios are still on sell signals, breadth has been poor and thus the breadth oscillators remain negative, and $VIX hasn't spiked. It is possible that these could improve: $SPX isn't that far from breaking through the first resistance at 1320-1330, the put-call ratios have rolled over from these levels in the past, and a few days of advances could give us breadth buy signals.
However, unless those things actually occur, we will remain bearish, expecting another challenge of support near 1275, and perhaps a challenge of the "true" (January overnight) lows near 1250, basis $SPX. If those downside levels fail, then the next support is at the Summer of 2006 lows near 1225.
Lawrence G. McMillan is the author of two best selling books on options, including Options as a Strategic Investment, recognized as essential resources for any serious option trader's library.