| Weekly Outlook in the Stock Market |
| By Price Headley |
Published
03/16/2008
|
Stocks
|
Unrated
|
|
|
|
Weekly Outlook in the Stock Market
NASDAQ Composite
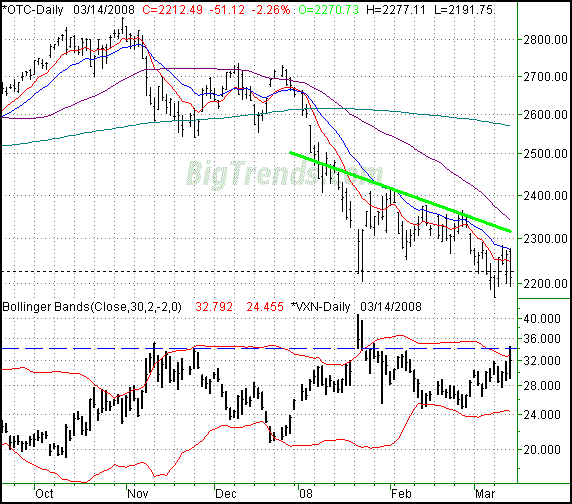
The 51.12 point dip for the NASDAQ on Friday left it at 2212.49, a 2.26% loss. For the week, the index ended almost perfectly flat, though doing so may overstated its strength. It clearly ended the week pointing lower.
One thing's become clear over the last few weeks, the 10- and 20-day lines (red and blue, respectively) are resistance levels. The thick, green resistance line is a factor as well, but hasn't been in play nearly as much as the 10- and 20-day averages. Both point to more bearishness ahead for the market.
On the other hand, the VXN is nearing levels that say we may finally be getting a bullish break, at least a short one. The VXN's peak of 34.47 on Friday put it back up to the upper Bollinger band as well as the November highs, which prompted a small bounce. No, the high of 34.47 doesn't match the January peak of 40.77 for the VXN, but that was a very unusual scenario for both the VXN as well as the composite.
The point is, conditions are right for a little relief, maybe a retest of that resistance line (at 2315) or the 50-day line (at 2345). We wouldn't bet on any move above that level. In fact, we'd be profit-takers and short sellers at that level, cognizant of the bigger trend here.
By the way, with the Fed on tap for this week, there's an obvious potential catalyst for such a bounce. In that regard, we're very short-term bullish -- as in one week. Past that, we feel the bears are still in control, and we expect to see the OTC make even lower lows before finding a bottom.
NASDAQ Composite Chart - Daily

S&P 500
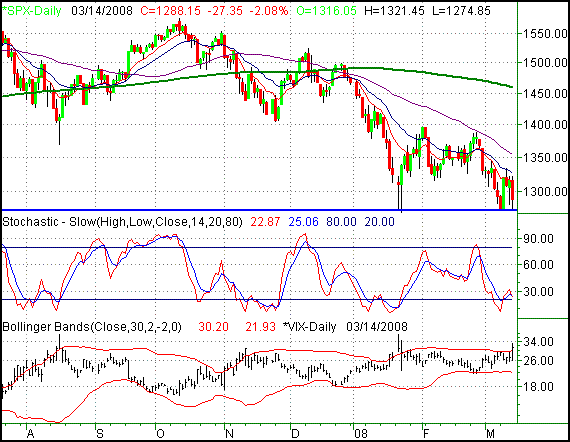
After suffering a 27.35 point dip (-2.08%) on Friday, the S&P 500 closed at 1288.15. On a weekly basis, this large cap index was the only one of out three to close in the red, by 5.2 points, or 0.4%. More importantly, she's on the verge of new lows for the year -- not good for the bulls.
The line in the sand is 1274. That's where the S&P 500 has made lows this month as well as January. Of course, the attack on that support level has been much stronger this past week. So, we're looking for the floor to eventually give way. However, we're oversold now -- way oversold. The VIX appears to have peaked as well. Throw in the Fed's likely help this week, and you do have the ingredients for a small rebound. The problem is, the Fed's recent "help" has had no longevity.
S&P 500 Chart - Daily

Dow Jones Industrials
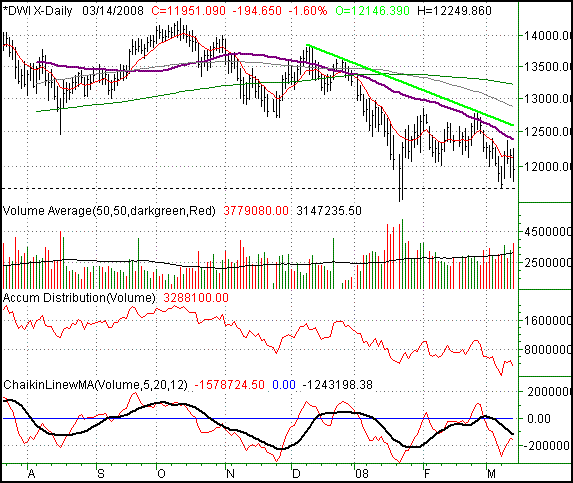
The Dow's close of 11,951.09 on Friday was the result of a 1.6%/-194.65 point selloff. Still, the blue chip index managed to make a slightly positive week, up 57.4 points, or +0.48%. Don't get too excited though, because the pressure remains to the downside.
Take a look at what happened back in late February -- the 50-day moving average line (the thick purple line) confirmed our worst fears by acting as a resistance level. As a result, we've made a lower low and lower high, extending the downtrend.
We can also see bearish volume has been heavier; the Chaikin line is pointed lower again. Tuesday and Thursday were technically accumulation days, but the bigger trend here is apparent.
A move under 11,691 may jump start the next wave of selling. Only a cross above the 50-day line and/or that green resistance line would be the beginning of anything significantly bullish. The Fed might be able to get the index up to those lines, but we don't think it will get the index past those levels.
Dow Jones Industrials Chart - Daily

Price Headley is the founder and chief analyst of BigTrends.com.
|