| Corcoran Technical Trading Patterns for March 17 |
| By Clive Corcoran |
Published
03/17/2008
|
Stocks
|
Unrated
|
|
|
|
Corcoran Technical Trading Patterns for March 17
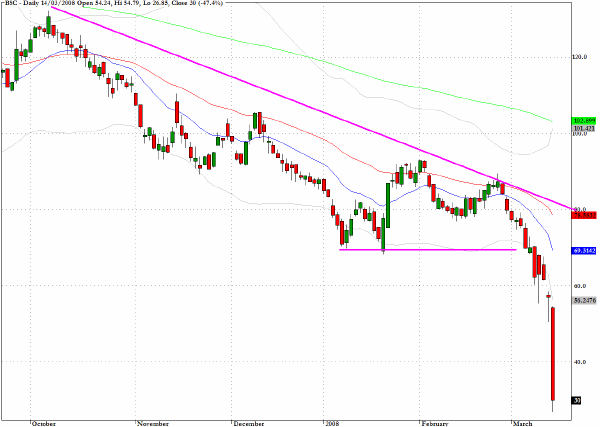
The chart of the day has to the one for Bear Stearns (BSC) which closed Friday at exactly $30. We now know, after emergency meetings in New York on Sunday evening, that the stock is worth just $2 this morning with an implied market cap of $240 million. JP Morgan is prepared to pay that for a business which at one point was valued at almost 90 times that. And there is a suspicion that JP Morgan was only prepared to pay that amount when it was provided with a $30 billion safety net under the assets on Bear's balance sheet.
Wow!
The developments of the last 24 hours make even more surreal some of the discussions from last Friday when several analysts and pundits busied themselves discussing whether Bear Stearns really faced a solvency crisis or a liquidity crisis. When a company attempts to profit from leverage of perhaps 20/30 times its actual cash holdings (as both Bear Stearns and Carlyle Capital were), it does not take much of a hiccough for things to unravel very rapidly.
If one was to take the comments of Bear’s CEO at face value (some unhappy hedge fund investors will remember that doing so last August was not a good idea), the rapidity of the un-raveling was truly spectacular. In Friday’s announcements the company suggested that the crisis had arisen within just the preceding twenty four hour period (conveniently putting the critical time-frame after a CNBC interview in which the company’s CEO denied that there were any problems). Class action lawsuits, citing a lack of transparency in Bear Stearns communications with its clients and investors had been piling up even before Friday’s demise, and one can only be curious as to who may be called upon to defend such litigation and if damages are awarded who may have to pay them.
Given the plunges in Asia and with Germany's DAX now down more than 3% and well below the August 2007 low, the open this morning in New York promises to be an ugly affair. Where might support be found on the S&P 500 in today's session? The 1220 area, which marked the lows from June 2006, would register a five percent fall from Friday. Although it is entirely feasible that we could do that all in one session it might require some whipsaws and short squeeze shenanigans first. On a longer term basis there are clear technical targets down to 1175 and 1140.
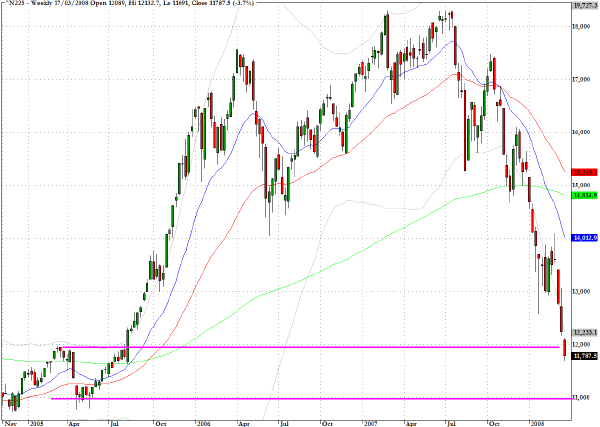
The Nikkei 225 (^N225) dropped below the 12,000 level that I cited in a CNBC Interview at the beginning of the year.
A key forex rate to watch during this coming week will be the cross rate of the dollar against the yen. The rate has now fallen well below 100 and further slippage has the potential to cause even more painful de-leveraging by hedge funds as carry trades are unwound.
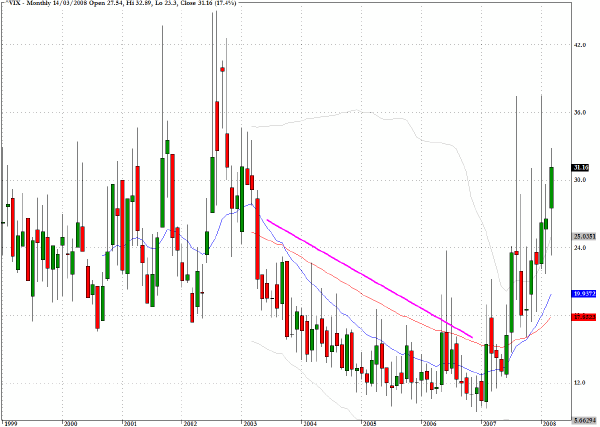
The long term monthly chart for the CBOE Volatility Index (VIX) takes in several financial panics and crises. One (perhaps cynical) way of interpreting the clear downward trend from 2003 until late in 2006 is that it coincides with the great period of financial engineering and expansion in securitization. The proliferation of almost limitless notional credit was accompanied by a growing belief that new structured credit instruments allowed for far better distribution of risk which in turn made the capital markets a much safer place.
On Friday the VIX move above and closed above 30.
What is notable about the right hand side of the chart is that heightened volatility is no longer episodic and sporadic as in the earlier period but has been steadily building since early 2007. To use some medical terminology the incidence of risk is now more of a chronic condition than an acute one.
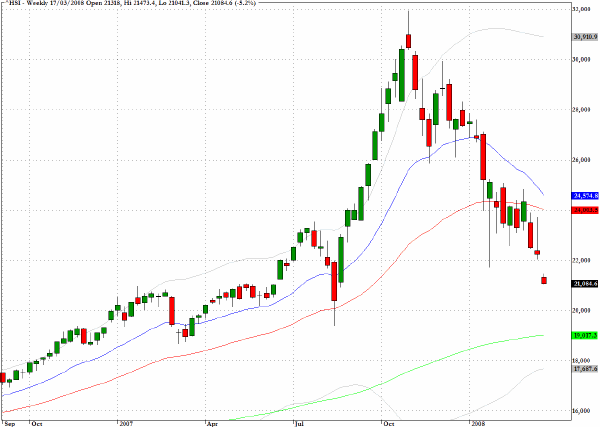
The Hang Seng index (^HSI) plummeted more than five percent in Monday' session. Remarkably the August low has still to be challenged which only highlights the extent of the "bubble" that developed in this market in late August and throughout September of 2007.
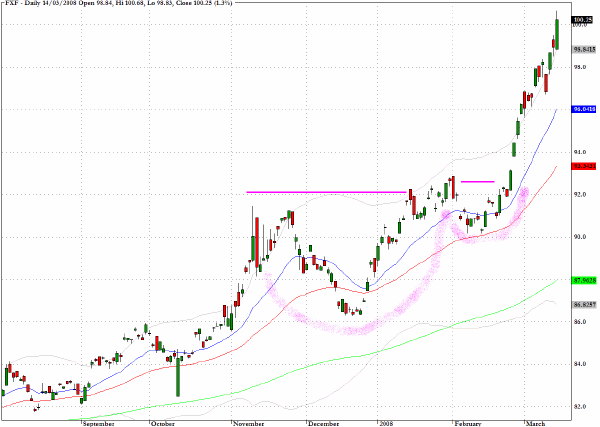
For those following the forex market, FXF, offers an exchange traded fund for the Swiss Franc, which allows one to profit on the short side of the dollar and benefit from further strength in the Swiss currency which has now broken for the first time below the parity level against the US dollar.
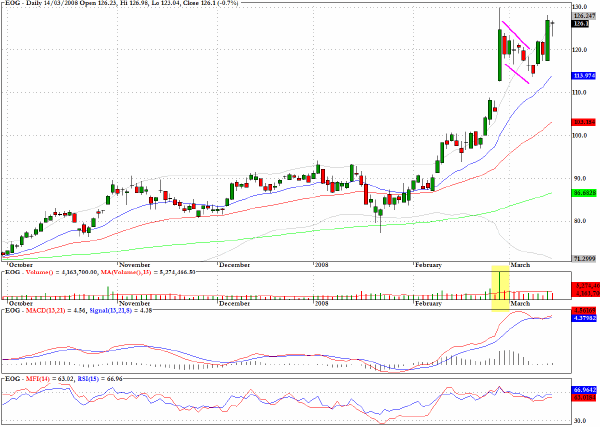
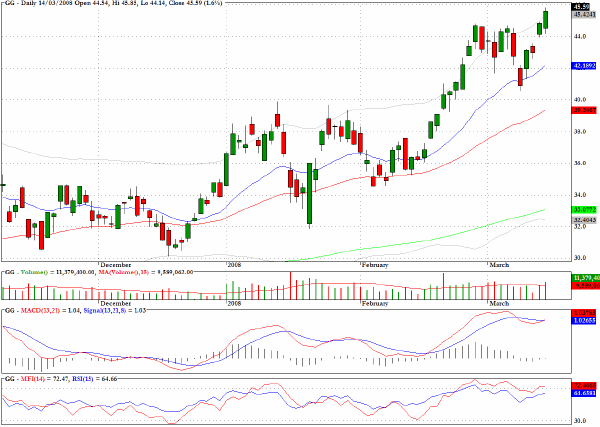
As follow up to last week’s recommendations on the long side, EOG Resources (EOG) moved ahead 8.3% and Goldcorp advanced by almost 7% in a difficult week to be on the long side.
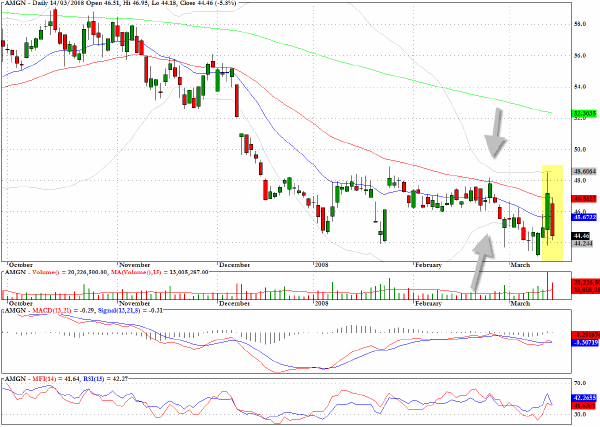
A long straddle options strategy for Amgen (AMGN) that was suggested here in February would have benefited from the recent abrupt breakout and reversal behavior.
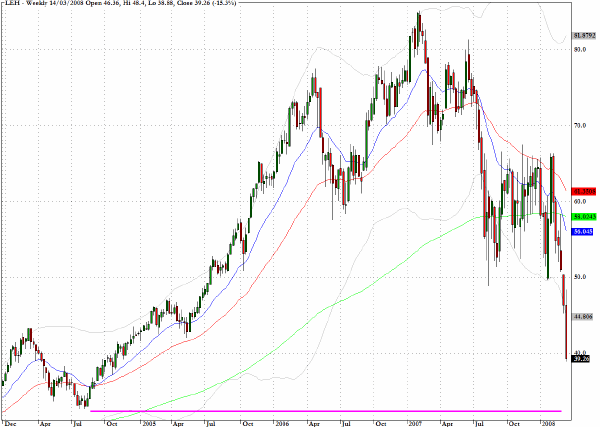
Keep an eye on Lehman Brothers (LEH) which fell more than 14% on Friday and which cannot be immune from some of the concerns that afflicted Bear Stearns.
The chart for Goldcorp (GG) shows the break above resistance at $44 and there is obvious potential for a continuation to higher ground.
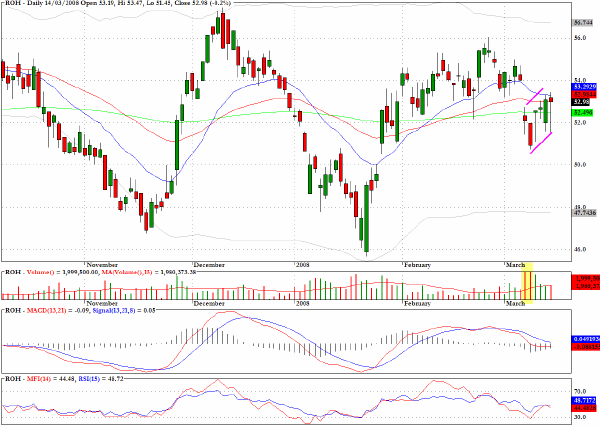
Rohm Haas (ROH) has a bearish pullback pattern and looks vulnerable as it closed near to clear resistance from the convergence of the 20 and 50 day EMA’s.
Clive Corcoran is the publisher of TradeWithForm.com, which provides daily analysis and commentary on the US stock market. He specializes in market neutral investing and and is currently working on a book about the benefits of trading with long/short strategies, which is scheduled for publication later this year.
Disclaimer
The purpose of this article is to offer you the chance to review the trading methodology, risk reduction strategies and portfolio construction techniques described at tradewithform.com. There is no guarantee that the trading strategies advocated will be profitable. Moreover, there is a risk that following these strategies will lead to loss of capital. Past results are no guarantee of future results. Trading stocks and CFD's can yield large rewards, but also has large potential risks. Trading with leverage can be especially risky. You should be fully aware of the risks of trading in the capital markets. You are strongly advised not to trade with capital.
|