| Taking a Technical Bite out of Apple (AAPL) |
| By Andy Swan |
Published
03/19/2008
|
Stocks
|
Unrated
|
|
|
|
Taking a Technical Bite out of Apple (AAPL)
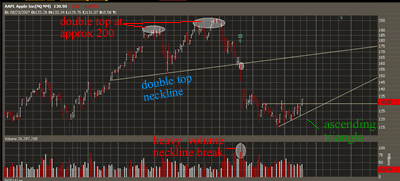
The bears have had control of the market for the past several months. The downside pressure has taken its toll on Apple Inc. (AAPL). Take a look at the 9-month daily bars chart below. There are a few things to point out.
First, note the double top price formation. The top was 200, and the neckline was 160, indicating a 40 point (200 - 160) measured move to the downside after the high volume neckline break. Forty points from 160 indicated a move to 120.
Second, note the stability at 120. The price point at which the measure move was completed. There was a push as low as 115, but AAPL stabilized right at 120 for the most part. This created a solid support level, which provides the bulls with confidence.
Third, note the pivot bottom that created with the pivot point at 115. The pivot bottom has matured into an ascending triangle, and AAPL is now putting pressure on the ascending triangle resistance level of approximately 132.00. A resistance break would be a bullish indication for AAPL, and the measured move indicates a push to 149.00, just below the massive psychological barrier of 150.00.

Andy Swan is co-founder and head trader for DaytradeTeam.com. To get all of Andy's day trading, swing trading, and options trading alerts in real time, subscribe to a one-week, all-inclusive trial membership to DaytradeTeam by clicking here.
|