| Corcoran Technical Trading Patterns for March 20 |
| By Clive Corcoran |
Published
03/20/2008
|
Stocks
|
Unrated
|
|
|
|
Corcoran Technical Trading Patterns for March 20
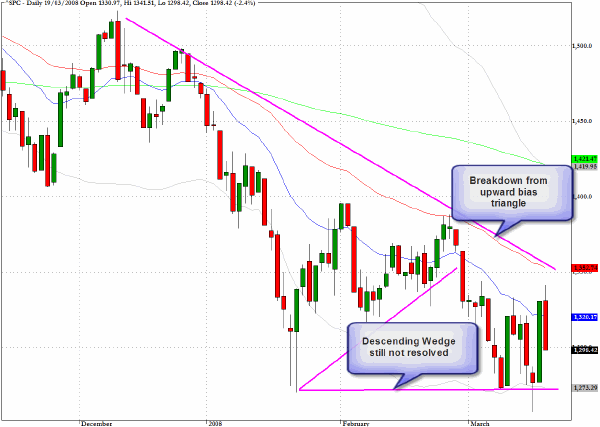
Along with the rest of the equity market, the S&P 500 (^SPC) failed to hold on to early gains and prolong the strong advance from Tuesday's epic session.
The pattern that is evolving in the index suggests that a definite directional breakout lies ahead. The breakdown from the triangular pattern with its upward bias that took place at the end of February was the first resolution of the hesitation about direction.
The descending triangle/wedge pattern appeared to be on the verge of being resolved in favor of a downward breakdown prior to the Fed's momentous decisions of the last few days. However, further uncertainty and indecision is reflected in yesterday's giveback.
The bulls would offer the interpretation that a further testing of the 1270 level would be very healthy and if, as is alleged, Monday's trading was the catharsis event from which embryonic bull markets are born then we should see strong buying emerge as we re-test 1270/1280. This would also fit neatly into an end of first quarter window dressing scenario.
My major concern with this interpretation is that too many talking heads are calling for it and new "bull" markets do not usually begin in such an obviously logical fashion.
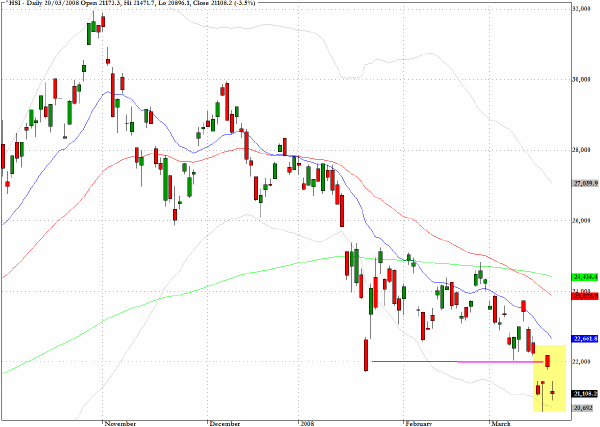
Many Asian markets, including Japan and India, were closed for public holidays today but the Hang Seng Index (^HSI) continued the downward trajectory that we have been focusing on recently. The index has reversed swiftly after Tuesday's rally and the pattern suggests that last August's low is proving to be a strong attractor that will require probing in coming sessions.
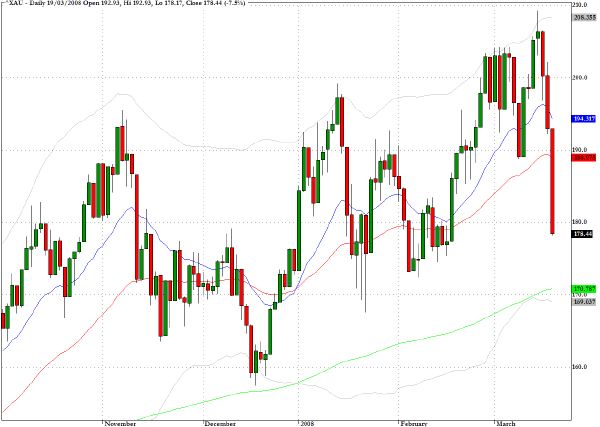
One of the main themes in yesterday's trading was heightened activity in many of the exchange traded sector funds, especially resulting in many ETF's that feature commodities slumping badly. Evidence of the major shifts can be seen in the chart for the Gold and Silver index (^XAU), which admittedly is not an ETF but shows as does the next chart which is such a fund the kind of vicious selling that arose yesterday in many commodities.
Several factors are at work here. There are signs that some institutions are rethinking their overall asset allocation strategies in the wake of the major policy moves that the Fed has taken over the last few days. Some re-allocations may be predicated on the view of some large fund managers that equities may have put in a base and be ready for a rally. Another, and I tend to believe, more palatable notion is that a lot of the hot money that had been creating bubbles in certain commodities was part of an overall bear raid on the financial sector that, having claimed a major victim, may now be re-grouping.
Yet another plausible factor is the de-leveraging that is taking place amongst hedge funds where each day seems to bring new margin calls.
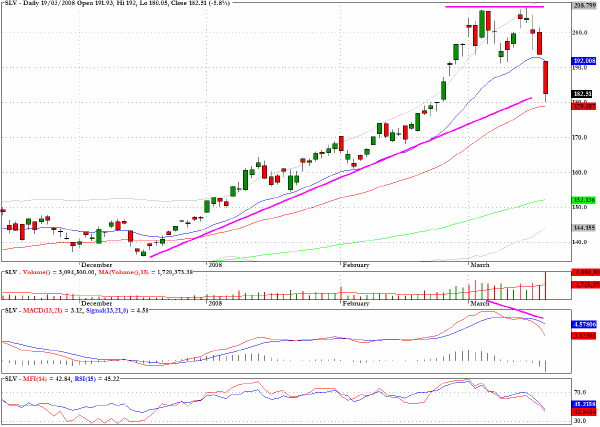
The exchange traded fund for Silver (SLV) has dropped precipitously in the last couple of sessions and the momentum and MFI chart reveal exactly the kinds of negative divergences that anticipated this.
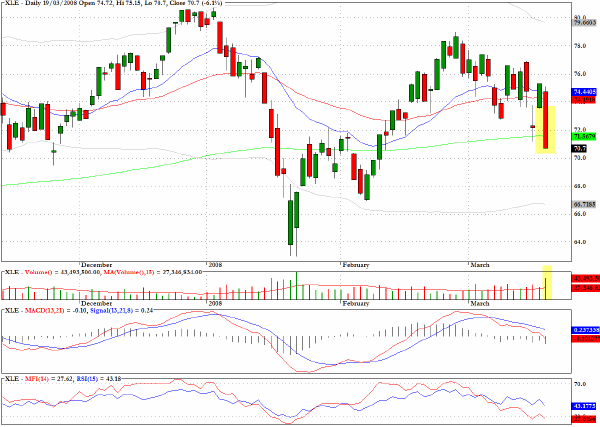
Further evidence that major asset allocation decisions are being made is revealed in the chart for the ETF that tracks the energy sector, XLE. The fund posted one of its largest drops of more than six percent and managed to break through all three moving averages on substantial volume.
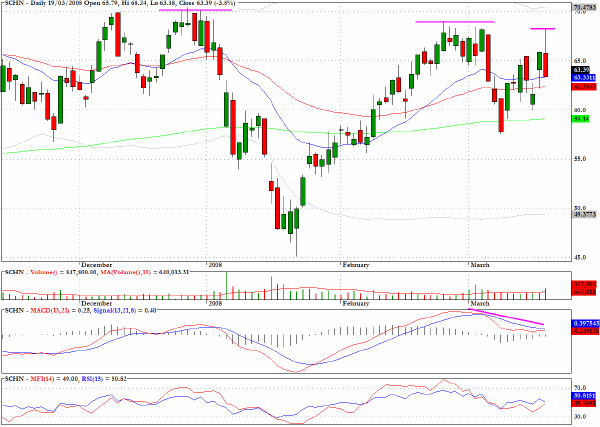
Schnitzer Steel Industries (SCHN) shows a series of lower highs and yesterday's shooting star formation and the negative momentum divergences put me on the short side for the intermediate term. As I mention in the disclaimers embedded in the commentary, this does not mean that I am suggesting that the stock will go down in today's session or even that I suggest going short during today's session but rather that I shall be looking for a good entry point to go short in the coming sessions.
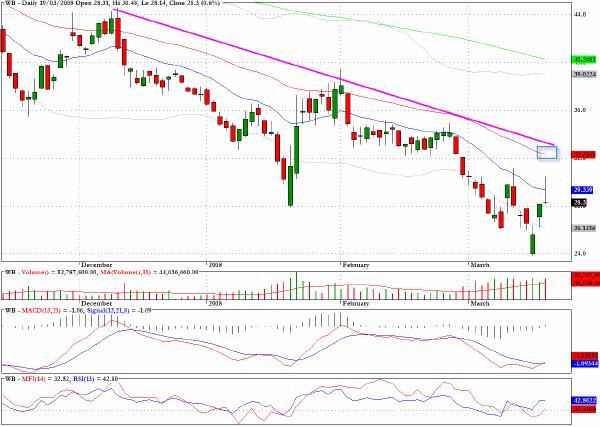
The chart for Wachovia Bank (WB) shows a rather striking candlestick with a long upper tail showing that the intraday gains yesterday were faded throughout the session with the stock closing more or less on its opening and low price for the session.
Although I remain cautious on the financials I would suggest that the stock has the possibility of making a move up to the clear line of resistance that is shown and which corresponds to the 50-day EMA.
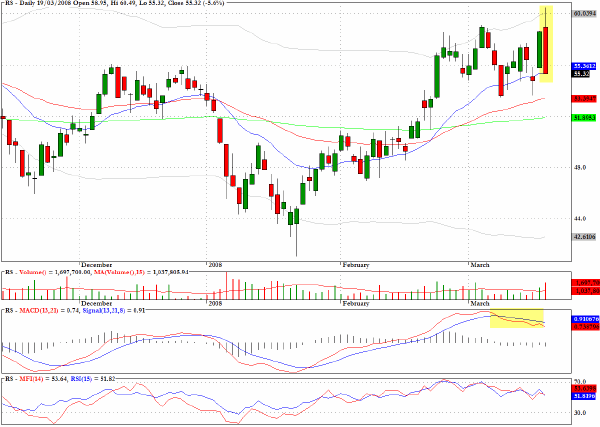
Reliance Steel (RS) is yet another example of a commodity based equity that looks vulnerable at least down to the 200-day EMA.
Clive Corcoran is the publisher of TradeWithForm.com, which provides daily analysis and commentary on the US stock market. He specializes in market neutral investing and and is currently working on a book about the benefits of trading with long/short strategies, which is scheduled for publication later this year.
Disclaimer
The purpose of this article is to offer you the chance to review the trading methodology, risk reduction strategies and portfolio construction techniques described at tradewithform.com. There is no guarantee that the trading strategies advocated will be profitable. Moreover, there is a risk that following these strategies will lead to loss of capital. Past results are no guarantee of future results. Trading stocks and CFD's can yield large rewards, but also has large potential risks. Trading with leverage can be especially risky. You should be fully aware of the risks of trading in the capital markets. You are strongly advised not to trade with capital.
|