NASDAQ COMMENTARY
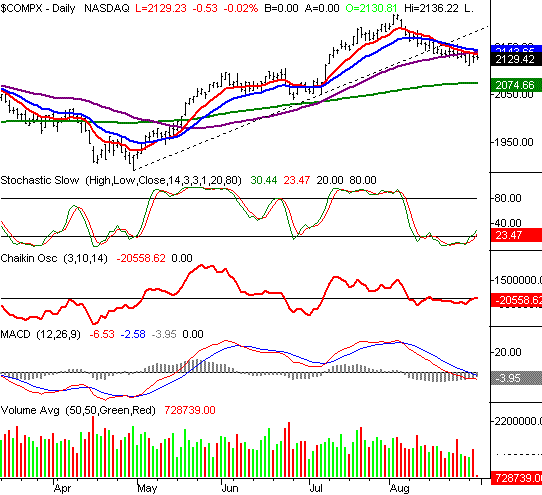
The NASDAQ is up slightly for the day, but as we've been cautioning, don't read too much into it. The composite is still unable to get back above any of the key moving averages, which would be the first evidence of a recovery move. In fact, the 10 and 50 day lines (red and purple, respectively) appear to be acting as resistance now. They're at 2137 (10 day) and 2139 (50 day), and today's high - so far - is 2136.22. At the very least, we'd need to see a break past 2139 to even think about being bullish. And even then, the 20 day line (at 2144) will likely serve as a barrier. Point being, today's strength alone isn't a whole lot to be excited about. But.........
Check out the stochastics indicator. We actually have our official buy signal. You may recall that, for us, the stochastic 'buy' occurs when both the %K and %D lines (green and red) cross above the horizontal line at 20. This is an indication that the oversold condition is finally being corrected. We still don't want to jump the gun though, so we're not going to make a call on the stochastics tool until Saturday's Weekly Market Outlook. But.......
We're also into our first day of a Chaikin line 'buy' signal. This is just a simple cross of the Chaikin line from below zero to above zero, telling us that the volume trend (degree of price change relative to volume) has turned bullish. This signal is far from complete though - we need today's closing price and closing volume to really use the data. So far, because stocks are up, the Chaikin line is in positive territory. But if the market sinks into the red again (a distinct possibility), the Chaikin line could fall back under that critical zero line. Again, we'll look at that on Saturday.
In the meantime, just sit tight. The bulls may be getting a little over-confident here, with a decent day and some gains for the week. However, these bulls haven't really been tested yet....until today. If we close strong, then we'll have to give the bulls some credit. But, a lot can happen in the four hours between now and the closing bell.
NASDAQ CHART - DAILY

S&P 500 COMMENTARY
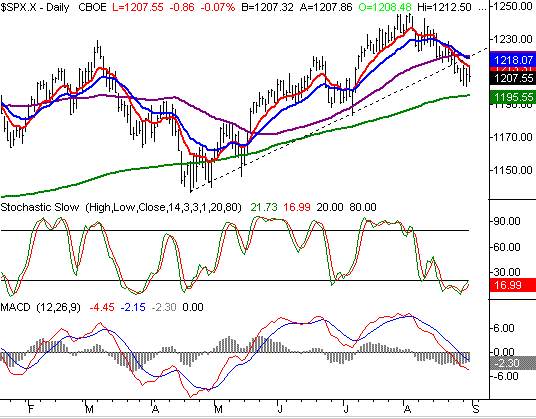
The S&P doesn't look quite as strong as the NASDAQ does. This large-cap index hasn't even really tested the 10 day line yet, and the stochastic buy signal we see for the tech-heavy NASDAQ isn't showing up on the SPX chart (although it's close).
The fact of the matter is that the S&P 500 is still in a downtrend - plain and simple. The bullishness we've seen this week doesn't change that. And we'll even concede that things could change by the end of the week. But as of right now, this chart is bearish. Not only has the index been unable to challenge the 10 day average, both the 10 and 20 day lines are now under the 50 day average. That's a signal that the short-term downtrend has just become something a little longer-term. And all of this is in the shadow of a break under the long-term support line (dashed).
Yes, we're up today, and for the week, but consider this - last Wednesday and Friday we're almost disastrous. Friday's close was nearly 12 points under the 10 day line. That's as far under the 10 day average that the SPX had been in weeks, so a little buying was to be expected. The question is, are the buyers exhausted? All we can say is this - in the grand scheme of things, there are still more sellers than buyers.
Resistance is at 1214 and 1218, while the 200 day average will be a potential support line at 1195.
S&P 500 CHART - DAILY

DOW JONES INDUSTRIAL AVERAGE COMMENTARY
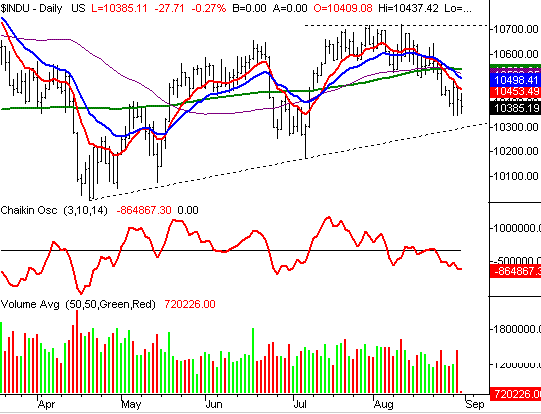
The Dow is the only index in the red as of the time of this writing, which really isn't a surprise when considering its recent woes. The Dow Jones Industrial Average is the only index under all of its key moving averages, including the 200 day line. And by far, the Dow has put up the worst numbers year-to-date, currently down by 373 points (-3.4 percent) since the end of last year. So, to see it struggle this week is nothing new.
What else can be said? Not a lot, really. The downtrend isn't an errant one, as the volume has been bearishly consistent with the trend. The Chaikin line here crossed under zero a week ago, and also a month ago. The index has followed the lead of those sell signals, losing 307 points from the highs when we first started to see the Chaikin sell signals. There's been nothing over the last few days that suggests an end to that trend is near.
On the flipside, the Dow is the only index that has yet to fall under its long-term support line (dashed). That's a testament to its stability. If nothing else, these large-cap companies may move slowly, but that includes both upward and downward movement. That support line is currently at 10,300.
Resistance is at the 10 day line, or 10,456, and again at 10,500, where the 20 day line is resting.
DOW JONES INDUSTRIAL AVERAGE CHART - DAILY

BOTTOM LINE
We basically said this same thing last week, but it's still just as true today.......where we are right now is a lot less important that where we'll be at 4 PM EST. A lot of buyers got too excited in the middle of the day last Wednesday - when the market was up between a quarter-to-half of a percent. They bought in, and a few hours later, they were punished for it - stocks closed more than half of a percent lower. By the end of the week, things were even worse. We're not saying this week will be a re-run, but we are saying that the middle of the week is a tricky time to read charts. That's why we're still leaning on the bearish side of things, despite the modest gains we've seen so far this week.
Price Headley is the founder and chief analyst of BigTrends.com.