| Corcoran Technical Trading Patterns for March 26 |
| By Clive Corcoran |
Published
03/26/2008
|
Stocks
|
Unrated
|
|
|
|
Corcoran Technical Trading Patterns for March 26
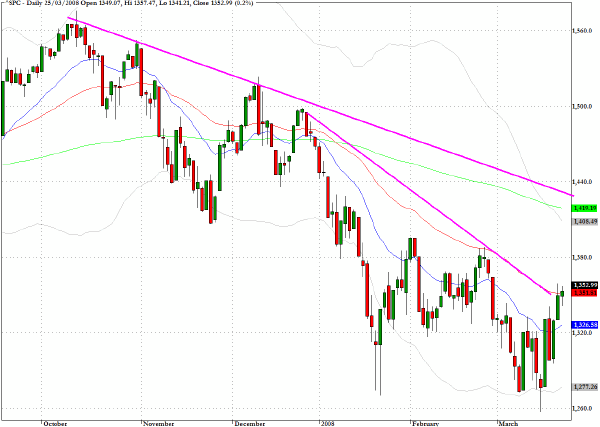
The S&P 500 (^SPC) is poised at a key level where it is facing the possibility of breaking free from the nested triangular patterns which have characterized chart patterns for several weeks.
As the trendlines indicate there is now the likelihood of an upward breach of the more severe downtrend line which tracks the 50 day EMA. Should we see two decisive closes above this line then I suspect that we will rally back towards 1440 at least, which represents the value on the other trendline and just above the current reading for the 200 day EMA.
Certainly the mood amongst fund managers appears to have improved markedly just in the last few days and many are claiming that the rebound provides ample justification of the view that one should never fight the Fed.
There is clearly a risk that we have moved too far too quickly but the one significant background condition that has been hanging over the market for months - the possibility of collapses amongst major financial institutions - has clearly diminished as a result of recent lifebelts thrown to the money markets.
Although I may be accused of trying to have my cake and eat it, I would still pose as a vital caveat that very critical support in the region of 1260 must hold on any reversals and if we close below that level I would expect selling to rapidly accelerate and, in such a circumstance, the Fed is close to having exhausted its supply of lifebelts to rescue the market from a severe drop.
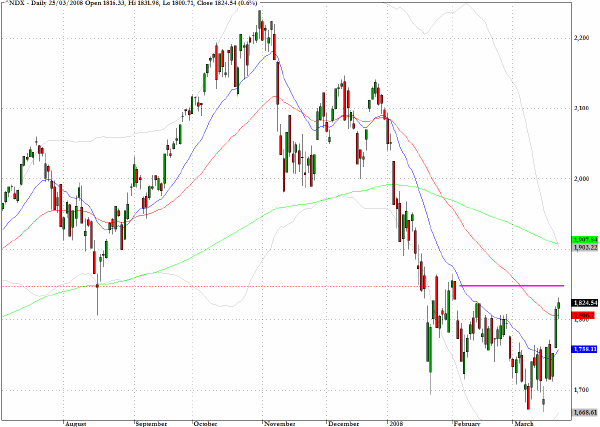
The Nasdaq 100 (^NDX) has chalked up a gain of more than eight percent since its close at 1687 on the Bear Stearns inflection session of March 17th. Yesterday's close was just above the 50 day EMA which suggests that the easy money has probably been made in the near term. Even if we should advance a little further in the few remaining sessions of the first quarter the 1845 level will present itself as a major chart hurdle.
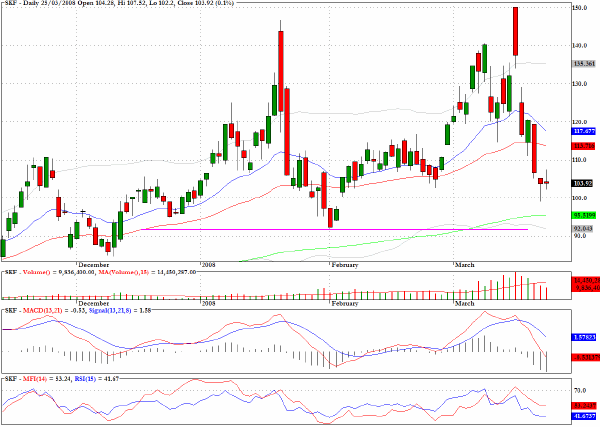
An alternative way of perceiving the double bottom in the banks and other financials which has been attracting a lot of attention from many analysts is to look at the sector fund SKF which acts a shorting vehicle for the financial sector and which even more strikingly reveals the recent double top for this inverse fund. Going long this fund as it approaches the 200 day EMA is one strategy to contemplate for those who believe that path ahead for the banks will be prone to swift reversals.
At the macro-market timing level one of my favorite proprietary indicators which measure whether key sectors and assets classes are becoming more or less correlated in the co-movements of their prices, turned positive at the end of last week. The manner in which this indicator works is that when there is a notable jump in the degree of inter-market correlation this points to seizing up of liquidity and an impairment of two- way trading. When the degree of correlation declines quickly and remains at a relatively low reading for several sessions this points to a positive improvement in the overall liquidity and often marks an intermediate turning point.
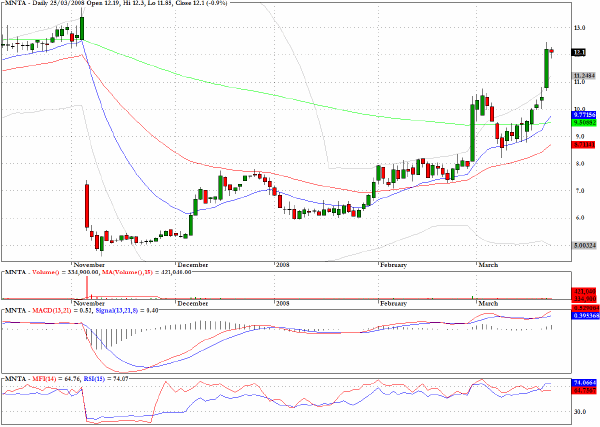
One week ago I cited the favorable pullback pattern on the chart for Momenta Pharmaceuticals (MNTA). The stock has moved up more than 20% since then but is now approaching a potential rejection level close to the early November high just above $13.
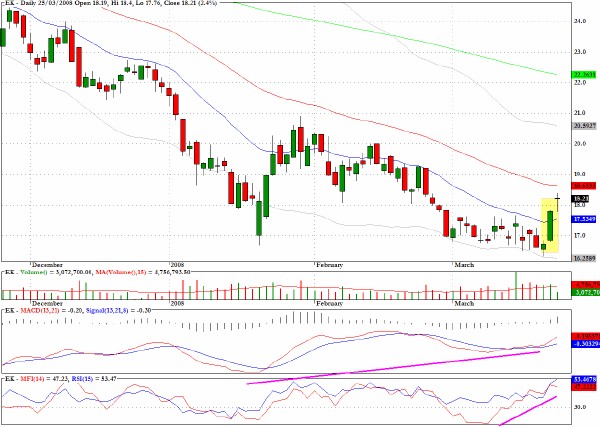
In my weekend commentary I featured Eastman Kodak on the long side and the stock performed unusually well in Monday's session with a 6.5% gain. There are positive divergences that suggest this could move higher but the hanging man formation just below the 50-day EMA is a reason to be cautious in the near term.
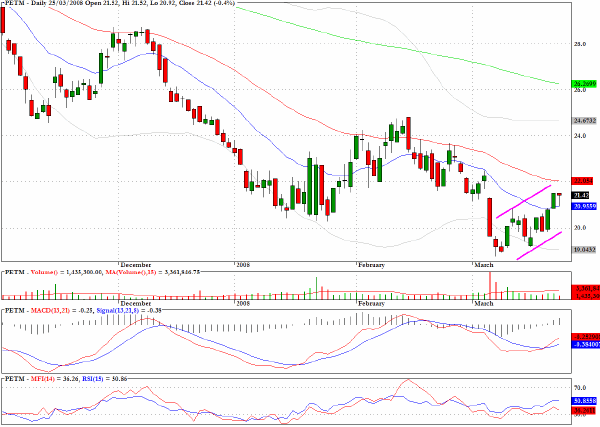
Petsmart (PETM) has the qualifying characteristics for a bear flag interpretation and the stock has moved up the ascending channel to probable resistance from the 50-day EMA which is just overhead.
Clive Corcoran is the publisher of TradeWithForm.com, which provides daily analysis and commentary on the US stock market. He specializes in market neutral investing and and is currently working on a book about the benefits of trading with long/short strategies, which is scheduled for publication later this year.
Disclaimer
The purpose of this article is to offer you the chance to review the trading methodology, risk reduction strategies and portfolio construction techniques described at tradewithform.com. There is no guarantee that the trading strategies advocated will be profitable. Moreover, there is a risk that following these strategies will lead to loss of capital. Past results are no guarantee of future results. Trading stocks and CFD's can yield large rewards, but also has large potential risks. Trading with leverage can be especially risky. You should be fully aware of the risks of trading in the capital markets. You are strongly advised not to trade with capital.
|