| Corcoran Technical Trading Patterns for March 27 |
| By Clive Corcoran |
Published
03/27/2008
|
Stocks
|
Unrated
|
|
|
|
Corcoran Technical Trading Patterns for March 27
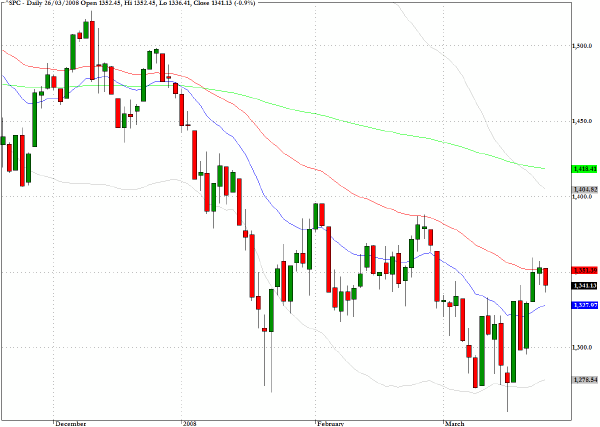
After rallying back to a level where resistance was to be expected from the 50-day EMA and at the 1350 level which marks the upper boundary of the descending wedge pattern that has been discussed here many times, the S&P 500 (^SPC) retreated in a fairly modest decline.
Volume was heavier on the down move than was seen on the upward move on Tuesday which is of some concern for the bullish argument. The economic data continues to show that the underlying economy is deteriorating, but just how much of that has already been discounted is hard to read. As suggested yesterday the real unknown is the extent to which the recent actions by the Fed will have removed a lot of the fear about financial doom which was also being substantially discounted during the bearish action of the last few months.
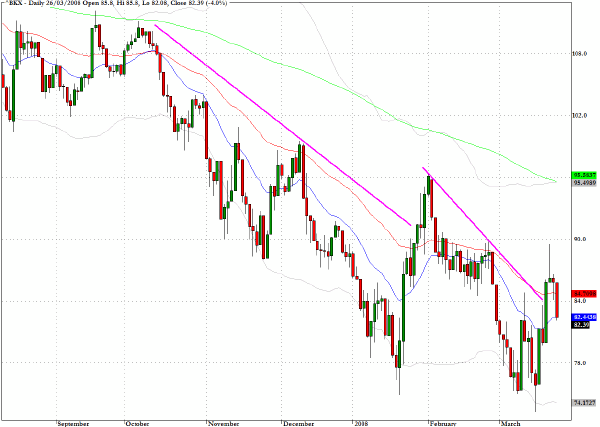
The banking index (^BKX) also declined after running into a clearly defined resistance level, but, as indicated on the chart, there is some suggestion that the downward trend-lines appear to be in a state of transition.
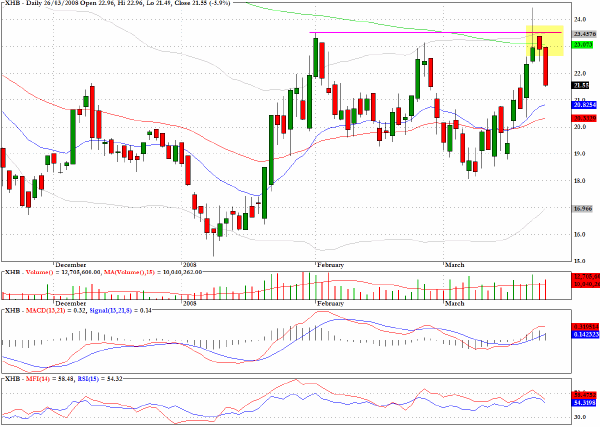
We should not be surprised by the price action in the homebuilders sector fund (XHB) yesterday, which, over and beyond all the weakness in the fundamentals, from a technical point of view, shows that the sector fund ran into resistance at the late January high as well as the 200-day EMA. A retreat to at least the 50-day EMA is now on the cards.
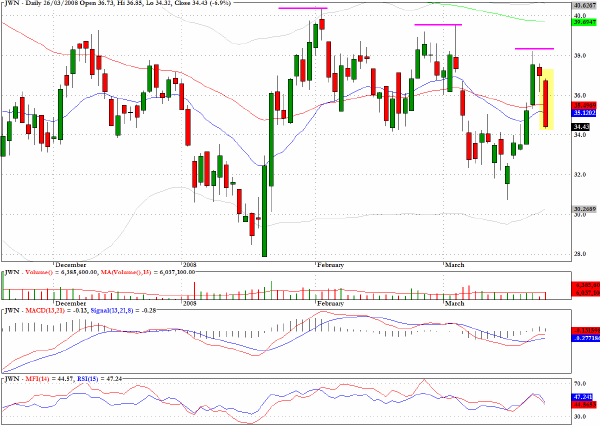
The chart pattern for Nordstrom (JWN) shows a series of lower highs interlaced with bearish pullback channels and the stock moved below two moving averages on increased volume.
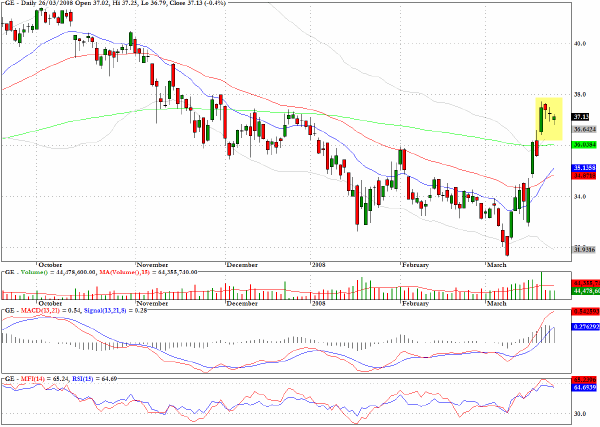
It is probable that General Electric (GE) could find renewed buying interest as it retreats to the 200-day EMA.
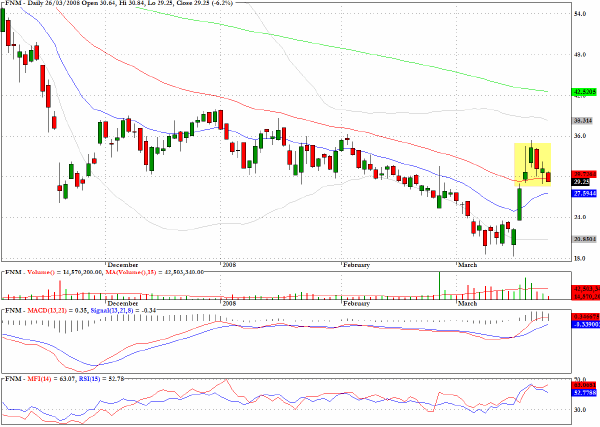
It would be surprising if the upward momentum that recently propelled Fannie Mae (FNM) above a key resistance level has been exhausted, and, also noteworthy is the fact that the current pullback has been on declining volume.
Clive Corcoran is the publisher of TradeWithForm.com, which provides daily analysis and commentary on the US stock market. He specializes in market neutral investing and and is currently working on a book about the benefits of trading with long/short strategies, which is scheduled for publication later this year.
Disclaimer
The purpose of this article is to offer you the chance to review the trading methodology, risk reduction strategies and portfolio construction techniques described at tradewithform.com. There is no guarantee that the trading strategies advocated will be profitable. Moreover, there is a risk that following these strategies will lead to loss of capital. Past results are no guarantee of future results. Trading stocks and CFD's can yield large rewards, but also has large potential risks. Trading with leverage can be especially risky. You should be fully aware of the risks of trading in the capital markets. You are strongly advised not to trade with capital.
|