| Where Is the Bottom in Housing? |
| By John Mauldin |
Published
03/29/2008
|
Currency , Futures , Options , Stocks
|
Unrated
|
|
|
|
Where Is the Bottom in Housing?
Existing home sales rose by 2.9% in February, the first significant rise in home sales since the housing market started to decline last year. I was in my car and listening to CNBC as commentators started to celebrate the bottom of the housing market. Since the credit crisis has its roots in the US housing market, and will require a resolution of the housing market in order for credit markets to return to whatever will look like normalcy in the future, it is of more than passing interest to get a handle on the actual state of the housing market. So while this is about the US housing market, it will also affect the credit markets worldwide, as well as impact China and other nations who sell to the US, because of the connection with consumer spending. This week we look at the data from sources that are actually involved in analyzing these markets. It will make for interesting reading. This week's letter will print out rather longer than usual, as we are going to look at a lot of charts, but the actual word length will not be all that long.
Housing - Finding the Elusive Bottom
Let me acknowledge up front that much of what you will read is from two main sources. The first is John Burns of John Burns Real Estate Consulting, which he founded in 1989. John consults with over 2000 of the largest banks and homebuilders in the country (his client list is a who's who of banks, builders, and hedge funds). He has a reputation for solid research and pulling no punches. Some of his hedge fund clients were the ones you read about who made billions. ( He wishes he had negotiated a percentage!) He is deeply involved in analyzing trends in the housing market. His web site is www.realestateconsulting.com. He has graciously put the PowerPoint presentation that I am working with on his site for you to read, should you want to dig deeper.
The second source is T2 Partners, a well-known value investing advisory firm in New York. They have a massive 76-page PowerPoint that you can review at your leisure at www.valueinvestingcongress.com, crammed with facts on the true extent of the problems in the subprime mortgage markets. It's rather sobering. While the thrust of the presentation is to analyze the true extent of the problems at Ambac and MBIA, there is a lot of data on the housing market as well. Remove sharp objects from your vicinity before you read it.
So, the question we seek to answer today: Have we seen the bottom of the housing market? Was last month's small rise a sign of the bottom, as many on CNBC and elsewhere opined?
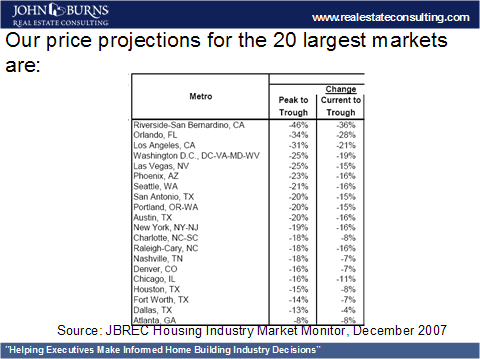
First, let's look at five graphs from John Burns (out of several hundred that he graciously allowed me to review!). Starting with conclusions first, John predicted a 15% decline in home prices early last year and has recently raised it to 16%. I pointed out that there are a lot of firms, like Goldman Sachs, who are more bearish, thinking home prices will fall 20-25%. He laughed and noted that last year he was the bear, and now he is the optimist. But he points out that 16% is a national average, with some markets projected to do a lot worse. Here are his projections for the 20 largest markets. Note that in every market there are still more price reductions projected.
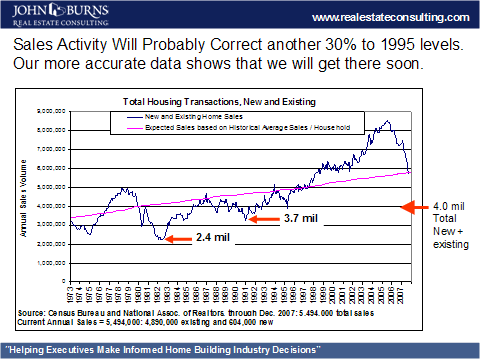
The reasons for the declines are many. Let's look at a few. First, we simply built more homes than the nation could absorb. In 2005 alone, there were 48% more housing-related transaction than there should have been. Note in the graph below the large rise since 2000 of transactions above the expected sales trend line. Sales are now back to that trend line, but are expected to fall further. Burns projects that sales activity will drop another 30%, to 1995 levels, and that will happen relatively soon.
This is going to mean that homebuilding is going to be forced to slow even more. Burns projects that permits to build new homes will fall anywhere from 32% to as much as 70% in the top 20 markets. The large majority of those markets have not seen permits fall even half as far as Burns think they will. Reality has not yet kicked in for many homebuilders. New and existing home inventories are hovering in the 10-month range and are likely to rise further as foreclosures put more homes on the market. This will likely mean that a buyer's market for at least another 3-4 years is the most likely scenario.
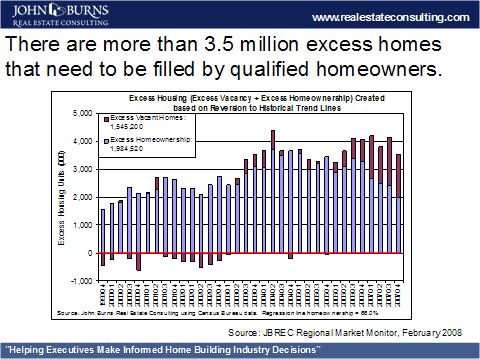
What all this speculation did was create 3.5 million excess homes that need to be filled. There are about 2,000,000 more homeowners than long-term trends would indicate, and many of these are buyers who used questionable mortgages to buy a home and are now in the foreclosure process. And as we will see later, it is going to get worse before it gets better.
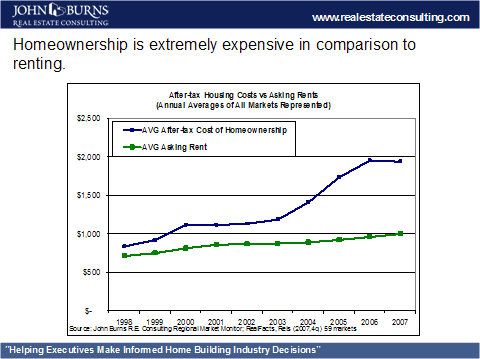
But with the dramatic drop in the availability of subprime mortgages, we have reduced the number of potential home buyers. In many markets, the affordability of housing simply prices out many potential middle-class buyers. And potential buyers of rental properties have not seen prices drop to where they can make a profit by buying and renting the homes. The following graph shows that nationwide it costs almost twice as much to buy a home as to rent. I know that it would cost me much more than twice in monthly costs to buy a condo or home that is the equivalent of my apartment. I can't mentally justify the extra expense today, although that may change, as there are a lot of condominiums coming onto the market this year in Uptown Dallas. It will be interesting to see if prices drop. Note the rise in the differential between renting and buying since 1998.
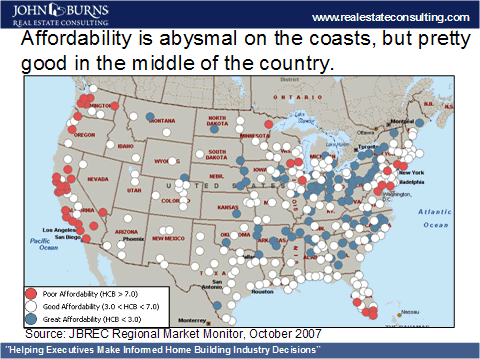
But here is where the picture gets clouded. There are parts of the country where homes are quite affordable. Note the difference in affordability between the coasts and the middle of America. So, we have to be careful when we talk about the crisis in housing. All real estate is local.
Let's look at a few more facts. Due to falling interest rates, a typical adjustable-rate mortgage (ARM) buyer saw his buying power rise 55% from 2000 to 2004. Since then there has been a 21% deterioration. That has helped lower sales traffic for new homes to the lowest level since they began collecting statistics in 1985.
But on a note of optimism, Burns notes the housing market is extremely cyclical. We have had times of extreme distress before, which typically last 3-5 years, and this one too shall pass. Burns projects that sales should be higher than current levels by 2012. Median resale prices will bottom out in 2010, only about 16% below the top.
Bottom Line? There is no Bottom in Sight
His most likely timeline is that resale stability will come back by 2011, and it will be even earlier for the homebuilders. He is projecting 6,000,000 home sales (new and existing) in 2008, but falling to only 4,000,000 in 2009. Low sales volume and high foreclosures will delay inventory reduction, which is required for there to be a stable market.
This means that home ownership will fall to 66% of the population in 2009 from the recent high of 69%. He thinks that may overcorrect to 65% in 2010. When I asked him why the overcorrection, he said it has to do with psychology. Housing will go from the greatest investment in 2006 to a bad one by 2009. The market typically overcorrects at the end of every cycle. It will take rising prices to lure the marginal homebuyer back into the market.
We discussed the recent rise in the price of the homebuilder stocks, which he attributes to short covering. Many of the homebuilders, public and private, are selling land at 16% of book value, or are trying to. He suggests that many of the privately owned homebuilders are in the worst shape.
Bottom line? We are nowhere near the bottom in the home markets.
Where is the Value in Housing?
In a lengthy presentation, the partners at T2 Partners state that we are still in the early innings of the bursting of the housing and credit bubbles, a theme I have also stated for quite some time.
Let's look at some facts they present. 8.8 million homeowners will have mortgage balances equal to or greater than the value of their homes by the end of March. 30% of subprime loans written in 2005 and 2006 are already underwater. Nearly 3 million homeowners were behind on their mortgages at the end of 2007, with 1 million at risk of imminent foreclosure. As of the end of last year, 5.82% (!) of all mortgages were delinquent, the highest level in 23 years. 0.83% were in the process of foreclosure, also an all-time high. When you look at just subprime mortgages, you find that 20% are delinquent (the number is rising rapidly), and almost 6% were in foreclosure. Finally, the average American's percentage of equity has fallen below 50% for the first time since 1945. Given Burn's forecast for prices, as well as that of T2 Partners, all these statistics are going to get worse.
The Real ARMs Race
As an example, 5% of home sales in January of 2007 in San Diego were foreclosures. In January of this year, 34% of existing home sales were foreclosures. This is going to turn into a monster wave as ARMs reset in the coming years.
As T2 notes:
"Loans with teaser rates were never supposed to reset. Reinforced by many years of experience, both lenders and borrowers assumed that home prices would keep rising and easy credit would keep flowing, allowing borrowers to refinance before the reset. Now that home prices are falling and the mortgage market has frozen up, very few borrowers can refinance, which, as shown later in this presentation, is leading to a surge in defaults -in many cases, even before the interest rate resets!"
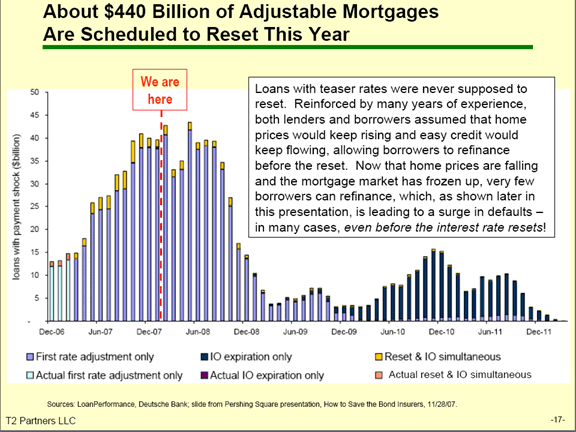
"Mortgage lending standards became progressively worse starting in 2000, but really went off a cliff beginning in early 2005. The worst loans are those with two-year teaser rates. As the subsequent pages show, they are defaulting at unprecedented rates, especially once the interest rates reset. Such loans made in Q1 2005 started to default in high numbers in Q1 2007, which not surprisingly was the beginning of the current crisis."
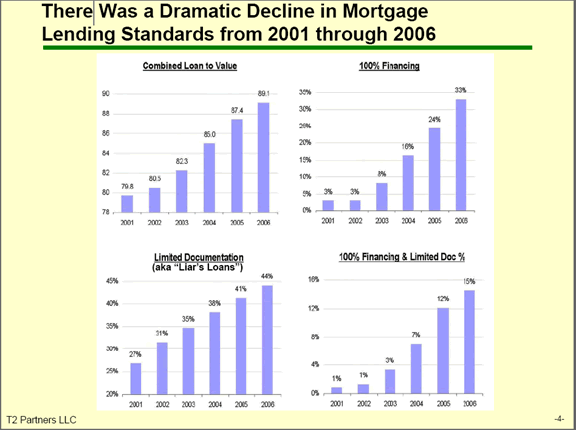
Look at the following chart, which shows the serious plummet in lending standards. How could a rating agency look at the statistics, which they surely had, and suggest that the probability of repayment would be the same as for loans made prior to this period? I mean, seriously. When 15% of loans in 2006 were for 100% loan-to-value with no documentation? Cue the lawyers.
"The crisis has continued to worsen as even lower quality loans made over the remainder of 2005 reset over the course of 2007, triggering more and more defaults. It takes an average of 15 months from the date of the first missed payment by a homeowner to a liquidation (generally a sale via auction) of the home. Thus, the Q1 2005 loans that defaulted in Q1 2007 are leading to foreclosures and auctions in early 2008.
"Given that lending standards got much worse in late 2005, through 2006, and into the first half of 2007, there are sobering implications for expected defaults, foreclosures and auctions in 2008 and 2009, which promise to drive home prices down dramatically."
And here is the most ominous quote in the entire 76 pages: "In summary, today we are only seeing the tip of the iceberg: an enormous wave of defaults, foreclosures and auctions is just beginning to hit the United States. We believe it will get so bad that large-scale federal government intervention is likely."
I sadly agree. In an election year, it will take a brave politician to resist the siren call of "caring." 2,000,000 potential foreclosures, which is rather typical of the estimates I have seen, will motivate politicians to do something. I hope that someone can limit the damage to taxpayers, but I have doubts. In later letters, I will comment on the possible bailout solutions. But let's get back to the facts.
Merrill Lynch may have to write down another $4.5 billion this quarter, with other banks also continuing to add to their losses. And it is going to get worse. There were $828 billion dollars of securitized first-lien mortgages made in 2005-7 that were comprised of loans that have little or no historical precedent in terms of documentation or loan-to-value. Another $56 billion in second-lien mortgages were made with little or no attempt to actually and properly value the loans. These are loans that are likely to be in trouble.
A realtor friend in Dallas tells me she is involved in a "short sale," or an offer to the bank to buy a home for less than the mortgage on the home. They are offering $560,000 for a home with a first-lien mortgage of $620,000. I said that doesn't sound too bad. Then she told me there was a second-lien mortgage for over $400,000 that will be completely wiped out. We are talking about a home that lenders were willing to loan over $1,000,000 on a year ago, that is going to sell for less than 60% of that. $1 million dollars in a Dallas suburb will buy you a lot of home. There has been no bubble here. And now, evidently $560,000 will buy you a great home. Securitized second-lien mortgages are in real trouble. There are still tens of billions to be written down. And many of these loans were (and still are) rated AAA, don't you know!
In a series of slides, T2 Partners graphically shows how lending standards plummeted in 2005-7. Default rates for June 2005 no-documentation loans (so-called liar's loans) are already over 30% in some categories. T2 projects that for no-doc loans from late 2005 and on, default rates could climb to over 70%!
Citigroup projects that mortgage losses will exceed $300 billion. T2 thinks this is way too low. They look at several mortgage-backed securities and slice into them. In one, the average loan is only 17 months old. Already 20% of the loans are 90 days delinquent or worse, and another 9% are 30-60 days delinquent. Statistics suggest that 65% of these loans will go on to become 90 days or more and then into foreclosure. And the interest rate resets have not even started!
Go back to the second chart from T2. The combined loan-to-value of the loans made in 2006 was 89%. That means the average loan from 2006 is already underwater. 33% were made with 100% financing. With home values down in some areas by 40%, the temptation to simply walk away is going to be large. It will take many years for a homeowner to have any equity.
One bright spot? Homes in the bubble areas are going to once again become affordable to middle-class citizens. Teachers, policemen, and firemen who could not afford to live in the cities they worked for will now have an opportunity, as will the young who have yet to buy their first home.
It's time to hit the send button. So, let's wrap things up. Those who think we are close to a bottom in the housing bubble are engaged in wishful thinking. You read above what those who really do their homework are saying. If we had more space, I could give you even more statistics and forecasts from Gary Shilling, Greg Weldon, Dr. Nouriel Roubini and others who do their homework, rather than trying to see a trend in one month's statistics. Many of the home sales from February are foreclosures. Those are going to rise. The key pieces of data to look at will be the months of supply of homes for sale and foreclosures. Until the supply of homes gets back to 6 months, we will probably not have seen the bottom. Until we have worked through the millions of foreclosures that are in front of us, it is hard to think in terms of a bottom.
We are in a recession, and that means rising unemployment and falling consumer spending. It means tighter profit margins. Etc. It is going to take a long time for the economy to recover. Welcome to Muddle Through.
One final thought: If we do end up with a government bailout, and I agree that it's likely, I sincerely hope that no one who cannot document that the information they submitted for their no-documentation loan was accurate will be given any assistance. If you lied, you do not deserve taxpayer money. If you took out a loan on which you could not demonstrate that you could make the payments, just because you wanted to profit from a resale of a home which was "surely" going to rise, you should not get tax-payer money. For every person we help like that, we keep a house from going down to a price that someone who deserves a home and has played by the rules could buy. Just my take.
John Mauldin is president of Millennium Wave Advisors, LLC, a registered investment advisor. Contact John at John@FrontlineThoughts.com.
Disclaimer
John Mauldin is president of Millennium Wave Advisors, LLC, a registered investment advisor. All material presented herein is believed to be reliable but we cannot attest to its accuracy. Investment recommendations may change and readers are urged to check with their investment counselors before making any investment decisions.
|
|