| Weekly Outlook in the Stock Market |
| By Price Headley |
Published
03/31/2008
|
Stocks
|
Unrated
|
|
|
|
Weekly Outlook in the Stock Market
NASDAQ Composite
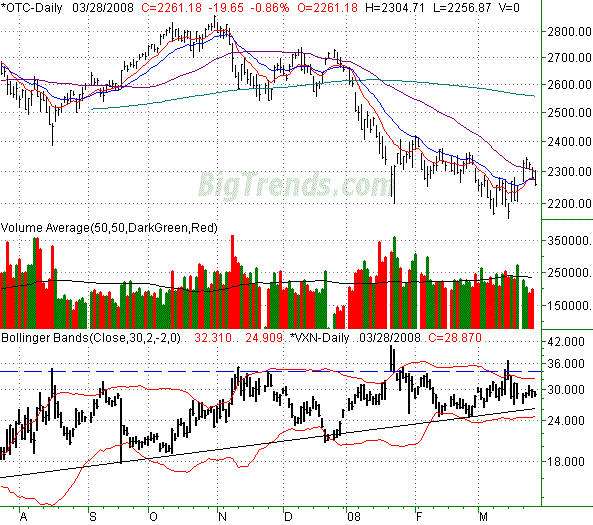
The close at 2261.18 on Friday was the result of the NASDAQ's 19.65 point dip (-0.86%). For the week, it was the only index to end in the black, though only by 3.07 points (+0.14%). Yet, we have to expect at least a little more bearishness ahead, based on the way we closed out the week.
The cross back under the 50-day average line (purple) after failing to stay above it after Monday's surge? That's the key signal here.
On the other hand, the market has not done a good job this year of making any follow-through (bullish or bearish). That's why we don't ant to plan on this turning into a long-term move, at least not yet. In fact, if and when we get a strong, gapping bearish open, we'll probably turn into intermediate-term buyers there. Betting on the trading range has been the only good bet lately, and most of the reversals have started with errant opens.
In that regard, any bullishness will be just as short-lived unless the 50-day line can be crossed and stay crossed. We didn't see that happen early this week. If it does though, we'll look for a trip all the way back to the 200-day line (green) at 2555. The confirmation of such a move will be a close above this week's peak of 2346.
Once there no matter what, we'll be sellers again, anticipating that the bear market will get rolling again. In the meantime, check out the noose being tied around the VXN's neck. A rising support line, and a ceiling around 34? Something's got to give soon. The floor is more vulnerable than the ceiling, which means the market is actually subject to something of a rally (though not immediately). That theme coincides with the NASDAQ's return to and retest of the 200-day average line. Once the VXN is sub-20 again, we'll look for the bears to resume control.
NASDAQ Composite Chart - Daily

S&P 500
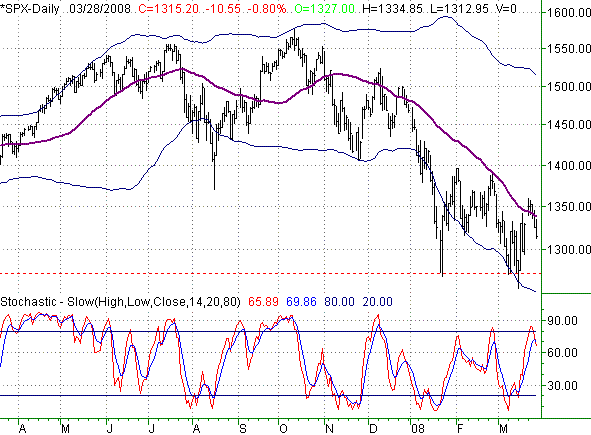
The SPX sank by 0.8% on Friday (-10.55 points) to end the session at 1315.20. That was 14.30 points below the prior week's close (-1.08%).
We'll be brief with the S&P 500 this week because we want to focus a little more on the Dow. However, we do need to point out one thing here.
On this week's charts we've plotted the SPX's 80-period Bollinger bands (+/- 2 SDs). Why? They basically seem to find the floor. The ceiling apparently is the 50-day line (purple). As such, that leaves up to 60 more points worth of downside before the lower band is met. That seems extensive, but don't rule it out. The index is officially overbought, and even coming out of that situation.
That is a bit at odds with our not-bearish-more-than-a-couple-of-days message. Welcome to trading. Perhaps a way to reconcile the mixed message is to say we're bearish until proven bullish.
S&P 500 Chart - Daily

Dow Jones Industrials
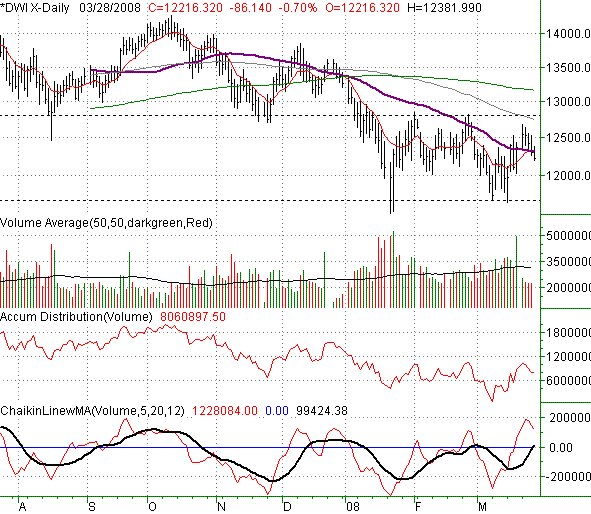
The Dow's 86.14 point tumble (-0.7%) on Friday led it to a close of 12,216.32. On a weekly basis, the blue chip index fell 145.0 points, or -1.17%. A little more of the same could be on the way.
There's one thing that sticks out very evidently on this chart - the sideways range the market has been trapped inside for a while. That range is marked with dashed lines on the chart below (at 11,650 and 12,815). Based on the direction we were headed as of Friday, a pullback to the lower line is a distinct possibility.
What happens after that will be the more interesting part. First and foremost, no matter what, we're drawing a major resistance line at 12,815. Only a move past that mark would be really bullish (and a push back above the 200-day line would mean even more).
However, take a look at the 10-day average (red) and the 50-day line (purple). The 10-day line is above the 50 for the first time since November. So what? Well, nothing yet. Technically it's bullish, though we're not too trusting of bullish signs right now.
More importantly though, it set up the possibility of a cross back under the 50-day line. If we see it happen, which would take a pretty good selloff, it would be the first crossunder that occurred under the 200-day line. In other words, your short, intermediate, and long-term momentum indicator lines would all be pointed the same way bearishly.
Like we said, it hasn't happened yet, but we are on the lookout for it. The only thing the bulls have going for then here is that the bears didn't come out in big numbers to end the week. The selling volume was fairly light. That may not matter in the big picture though.
Dow Jones Industrials Chart - Daily

Price Headley is the founder and chief analyst of BigTrends.com.
|