| Corcoran Technical Trading Patterns for April 1 |
| By Clive Corcoran |
Published
04/1/2008
|
Stocks
|
Unrated
|
|
|
|
Corcoran Technical Trading Patterns for April 1
News released this morning is sure to increase the propensity for greater due diligence on the part of sovereign wealth funds as they contemplate coming to the rescue of the large banks. UBS confessed to another multi billion dollar write-down on its mortgage backed securities portfolio and that it has to tap its shareholders for another 15 billon Swiss francs of equity. Ouch!
After having declared at the time of its last confession that it was then putting the worst behind it, and having lost all his credibility the bank's chairman had no choice but to resign joining the growing list of banking executives pulling the cord on their platinum parachutes.
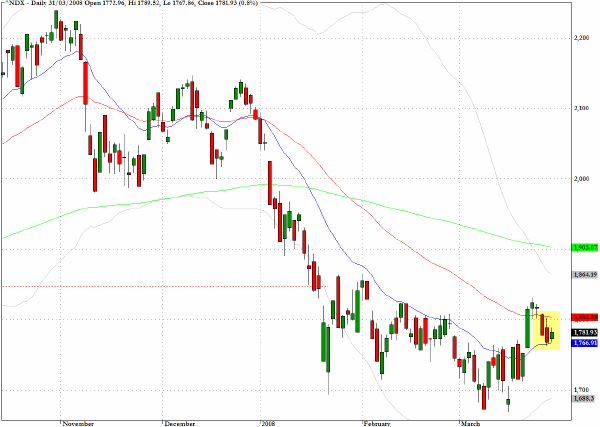
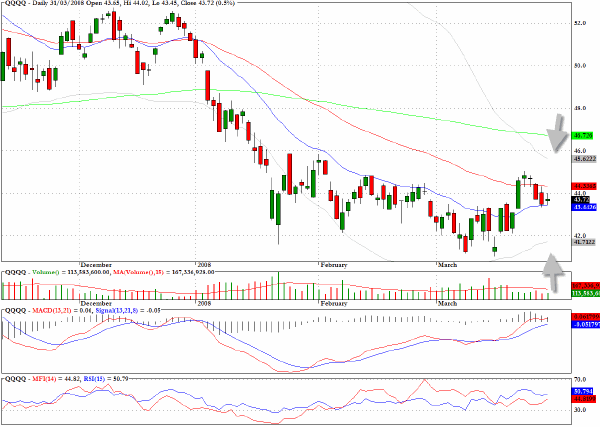
The last day of the quarter revealed a mildly bullish bias but the trading was largely uninspired and lacked conviction. Looking at many charts this morning what I am detecting though is that the range constriction evident in so many of the patterns suggests that decisive moves lie ahead. The Nasdaq 100 (^NDX) registered an inside day, remained above the 20-day EMA and as the QQQQ chart more clearly reveals the volatility contraction is becoming very noticeable.
Range constriction is very evident on the chart for QQQQ, the exchange traded proxy for the Nasdaq 100. An even more pronounced pattern is found on the chart for the exchange traded tech fund, XLK.
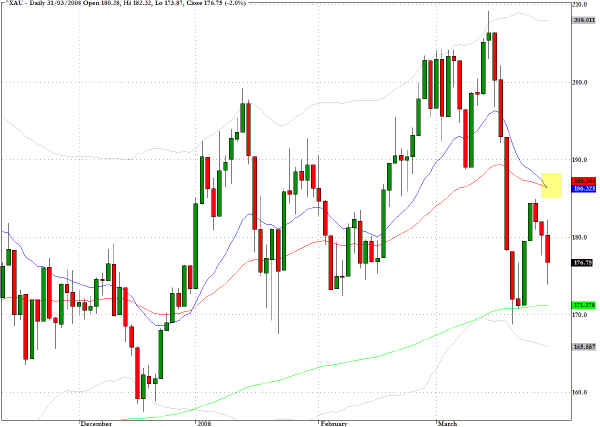
Reviewing many of the metals and mining stocks, there is evidence that the sector may have registered a major intermediate top during March. In my weekend commentary I suggested that the sector fund, XME, is worth keeping on the radar this week for entry opportunities on the short side. One such entry possibility would be to look at being short the gold and silver mining sector (^XAU) as it approaches the intersection of the 20- and 50-day EMA's.
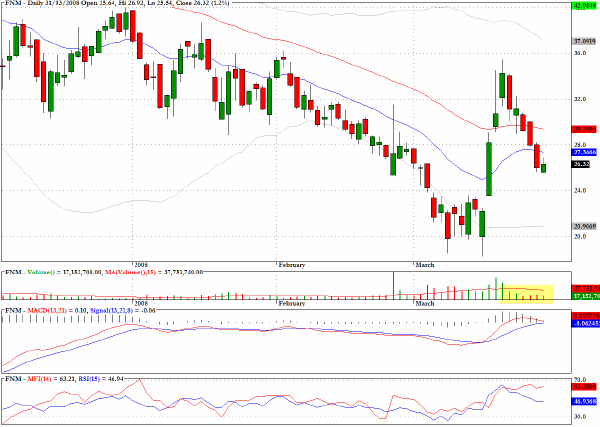
It would be surprising if the upward momentum that recently propelled Fannie Mae (FNM) above a key resistance level has been exhausted, and, also noteworthy, is the fact that the current pullback has been on declining volume.
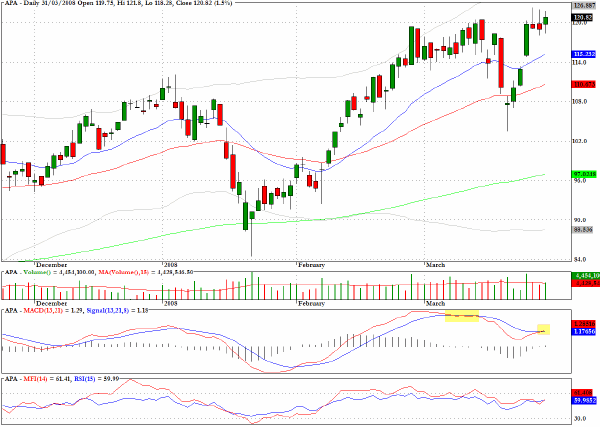
The daily chart for Apache (APA) is revealing indications of negative divergences as it tries to break through resistance at $120.
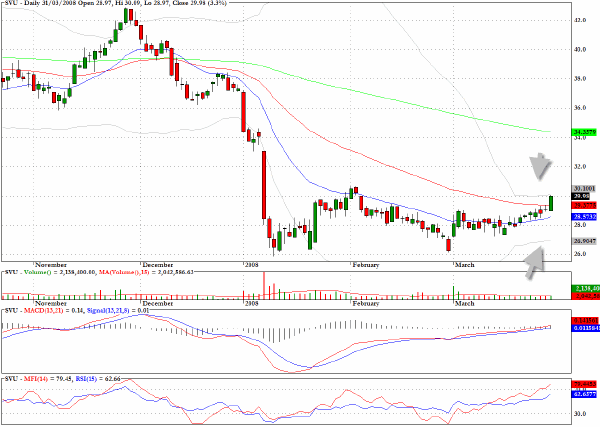
One of many charts that highlights the narrowness of the volatility channel is for SuperValu (SVU) which looks ready to break away from the constricted range. The basing pattern suggests that the direction should be upwards but whipsaws are often found at this juncture in range compression patterns.
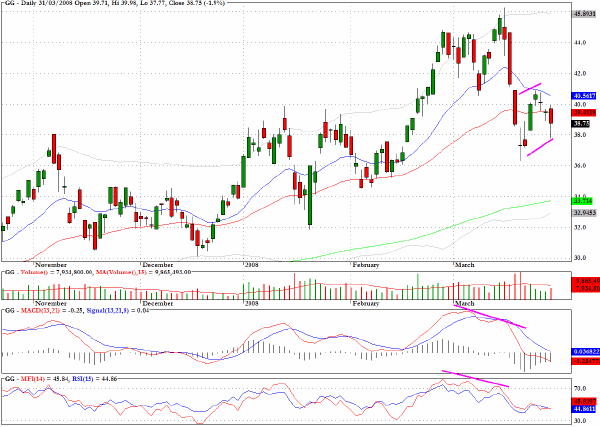
The chart for Goldcorp (GG) shows that a bear flag is forming.
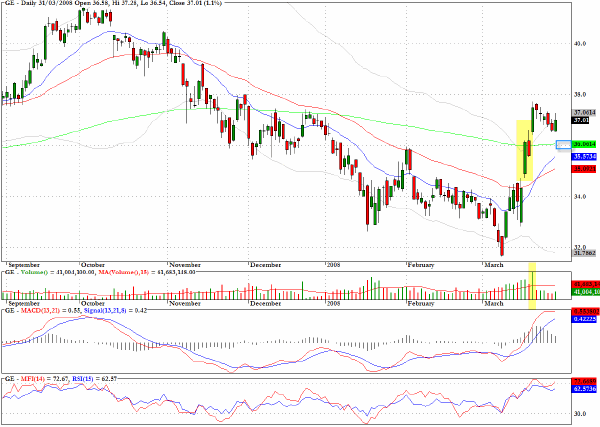
I shall simply repeat my comment from late last week that it is probable that General Electric (GE) could find renewed buying interest as it retreats to the 200-day EMA.
Clive Corcoran is the publisher of TradeWithForm.com, which provides daily analysis and commentary on the US stock market. He specializes in market neutral investing and and is currently working on a book about the benefits of trading with long/short strategies, which is scheduled for publication later this year.
Disclaimer
The purpose of this article is to offer you the chance to review the trading methodology, risk reduction strategies and portfolio construction techniques described at tradewithform.com. There is no guarantee that the trading strategies advocated will be profitable. Moreover, there is a risk that following these strategies will lead to loss of capital. Past results are no guarantee of future results. Trading stocks and CFD's can yield large rewards, but also has large potential risks. Trading with leverage can be especially risky. You should be fully aware of the risks of trading in the capital markets. You are strongly advised not to trade with capital.
|