| Some Larger Trends in the Stock Market |
| By Price Headley |
Published
04/1/2008
|
Stocks
|
Unrated
|
|
|
|
Some Larger Trends in the Stock Market
It occurred to me that the market's volatility over the last several weeks has gotten us sucked into a day-by-day mindset. By that, I just mean in all of our efforts to outguess the next day's action, we've kind of forgotten about where we are in the grand scheme of things.
To help solve the problem, today I want to look at the three major indices, but with a weekly timeframe instead of a daily timeframe. It should add some perspective on the quagmire we've been in the last couple of months.
NASDAQ Composite
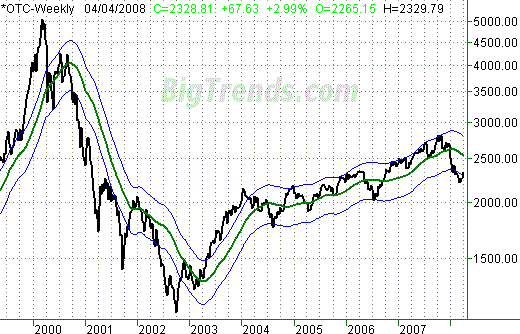
As with all the indices, we've been keenly watching the moving average envelopes (blue lines) for the NASDAQ This envelope is +/-8% of the 200-day line, and the 200-day line is plotted in green. As you can see, we fell out of the envelope in January. The recent rebound has pushed us back inside the envelope.
This puts us into something of a quandary. My original viewpoint was that we were at the beginning of a bear market. However, for the 2000/2002 bear market, the NASDAQ stayed under the lower envelope line most of the time. Take a look.
NASDAQ, with 8% envelope (200-day average) - Weekly

At this point, I'm inclined to only think the recent rise is a secondary counter-trend to the bigger downtrend. That's always subject to change, but I have no real reason to think otherwise yet. It's not a conflict either. Counter-trends are normal in any environment.
For me, the litmus test will still be the 200-day line, and what the NASDAQ does when it reaches it. I suspect the market has enough 'oversold' fuel to get that far (back up to 2545). I'm not counting on anything past that though.
S&P 500
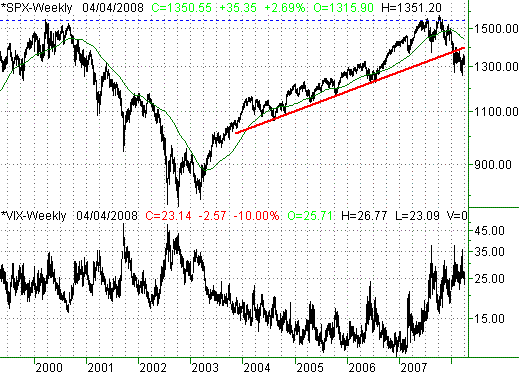
The SPX's chart really illustrates the greatest number of worries for me. For starters, don't forget that the S&P 500 sank like a rock just a few days after testing new high territory. That's marked by the blue, dashed line. Is that a psychological barrier?
Also, you can see the SPX decisively broke a long-term support line (red). Take a look.
S&P 500 - Weekly

There may be an upside out of all this in the VIX. It's at relatively high levels again. That's not inherently bearish or bullish. It just means we may be entering a period where we get some bigger moves, though the last two months seem to suggest otherwise.
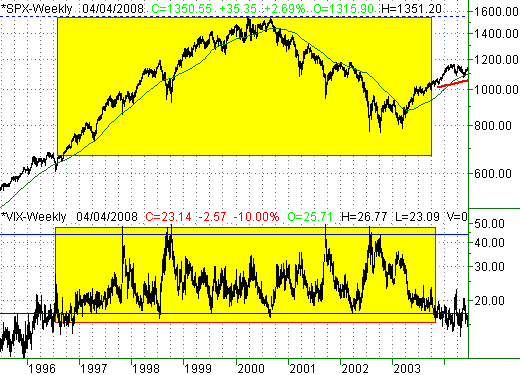
To really show why this isn't inherently bullish (some people seem to think the high VIX is a sign of a bottom), I scooted the chart back to show the late 90's and early 2000's. The VIX floated between 18 and 45 during bullish and bearish trends.
S&P 500 & VIX (1996-2003) - Weekly

Point being, don't read more into the VIX than you should.
Dow Jones Industrial Average
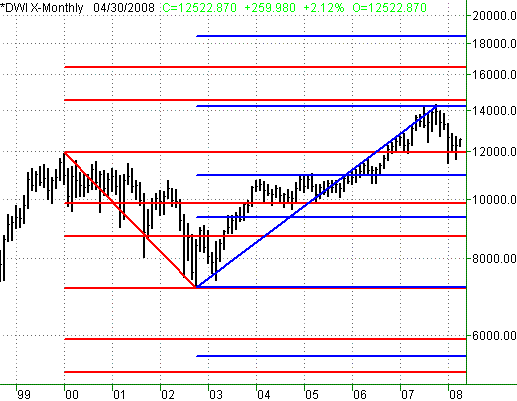
If you are familiar with Fibonacci lines, then here's the basic color code for my chart. The blue Fib lines are intended to be used to point out likely retracement levels. The 10,987 is a big one. There's also an extension line at 18,478.
The red Fib lines are intended primarily as extension lines of the 2000/2002 bear market. There's a major one at 14,520 (close to the recent peak), and another one at 16,442.
Dow Jones Industrials Average, with Fibonacci lines - Monthly

The Fibonacci lines don't mean a lot right now to any of us, but they will eventually.
Bottom Line
We wanted to set some perspective today, particularly for those of you getting frustrated with an indecisive market. We also wanted to plant a few seeds today so we could come back at a later time and make some bigger points.
Price Headley is the founder and chief analyst of BigTrends.com.
|