| Corcoran Technical Trading Patterns for April 2 |
| By Clive Corcoran |
Published
04/2/2008
|
Stocks
|
Unrated
|
|
|
|
Corcoran Technical Trading Patterns for April 2
Yesterday morning I commented that the volatility constriction on many charts suggested that a decisive move was imminent. The beginning of the new quarter and the news from UBS and Lehman provided exactly the catalyst that was required for the turning of the tide. In a slight variation on the traditional theme, the UBS news underlines the prevailing hedge fund strategy, with respect to the financials, which is Short on the Rumors and Cover on the News.
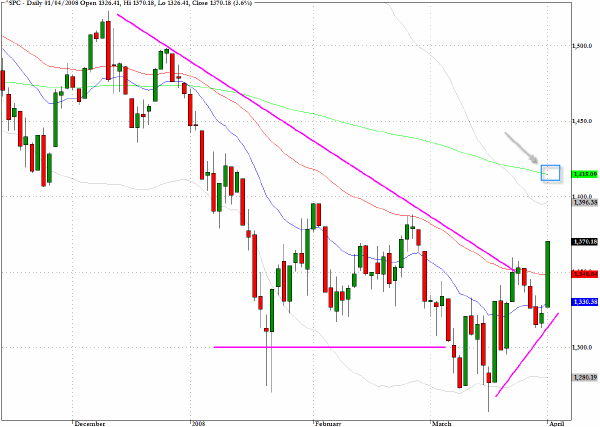
The S&P 500 (^SPC) surged through the upper boundary of the descending wedge formation and the breakout puts me in the camp that believes that a strong continuation rally is to be expected. This, however, will not be smooth sailing and strong reversals are inevitable as they are very characteristic of bear market rallies and the kind of action that was seen yesterday.
The next target on the S&P 500 is around 1415 which marks the 200-day EMA and also the 50% retracement level from the October 2007 high and the January and March lows. Beyond that there is a real chance for the index to make it back to a chart resistance/support level in the vicinity of 1450. The 62% retracement from the swing high/lows of the last six months are also found at 1453.
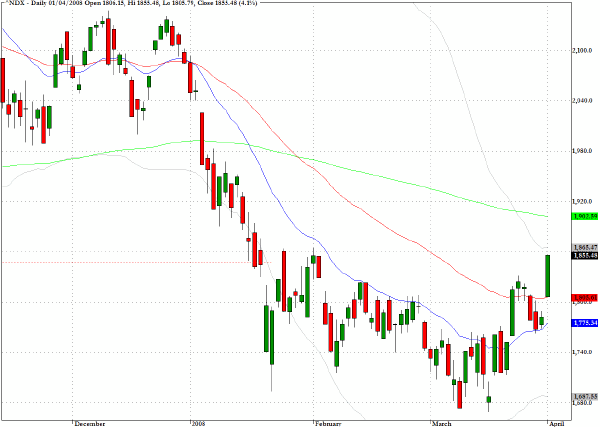
One of the many standout performances from yesterday's rally was registered by the Nasdaq 100 (^NDX) which moved up 4.1% and closed above the critical 1850 level that I have discussed here previously. The 1920 level marks the next area of potential resistance and lies not too far above the 200 day EMA. This target could be reached sooner rather than later but I would be surprised if we sail through that level without some consolidation.
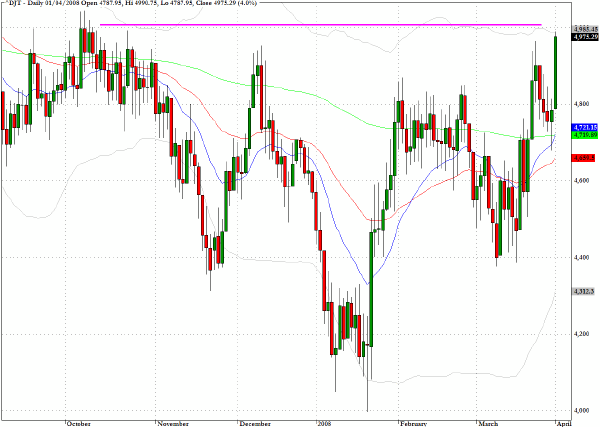
The Dow Jones Transportation index (^DJT) performed in line with the expectations outlined in Monday's letter as it reached up to just below the 5000 level intraday. On present evidence the patterns for this index suggest that it could mount the most plausible case that its historic highs from July 2007 could be back in play.
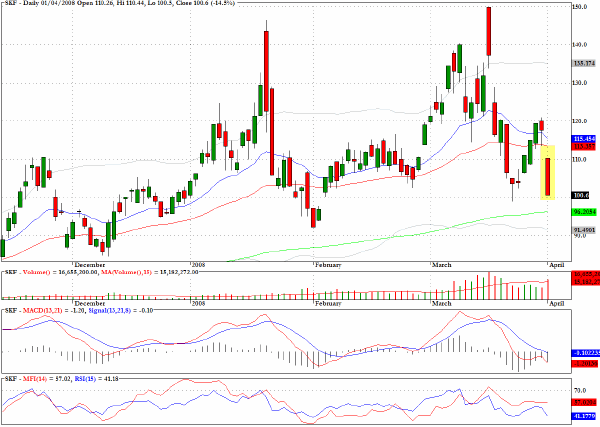
One of the most striking charts from yesterday is for the exchange traded sector fund, SKF, which provides a vehicle for being short the financials. The fund dropped by more than 14% as it offers a leveraged play of 2:1 on the Dow Jones US Financials index. On the way down for the financial this fund with its two to one leverage amplifies the bearish bet providing substantial returns for holders of the fund but rallies in the financials will also bring sharper losses to those long this fund. As suggested in my weekend commentary, shorting the fund allows twice as much profit when the banks and other financials move up than being long the alternative vehicle XLF.
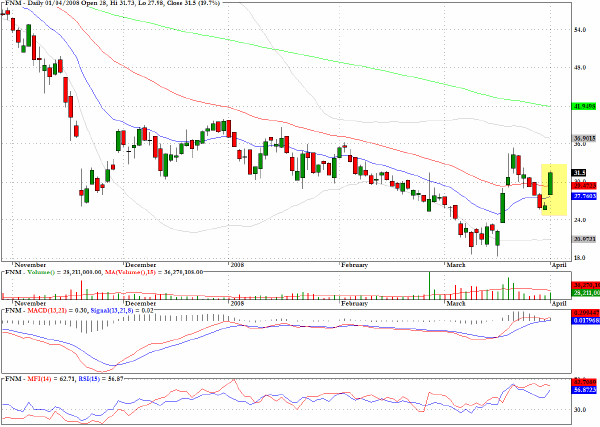
I was pleasantly rewarded by Fannie Mae (FNM) which I mentioned here last Thursday and also in yesterday's commentary - "It would be surprising if the upward momentum that recently propelled Fannie Mae (FNM) above a key resistance level has been exhausted, and, also noteworthy is the fact that the current pullback has been on declining volume."
Entry on last week's suggestion would have enabled one to get on board ahead of yesterday's large opening gap and would have returned more than 20% in three trading sessions.
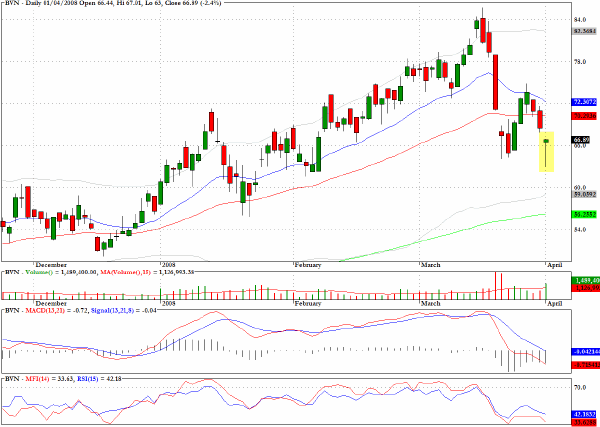
BVN has dropped out of the bear flag formation but the long lower tail and hammer pattern on the chart suggests that a further pullback in a nested flag formation could begin. Overall the mining sector is transitionining from being one of the more bullish sectors to one where distribution is taking place.
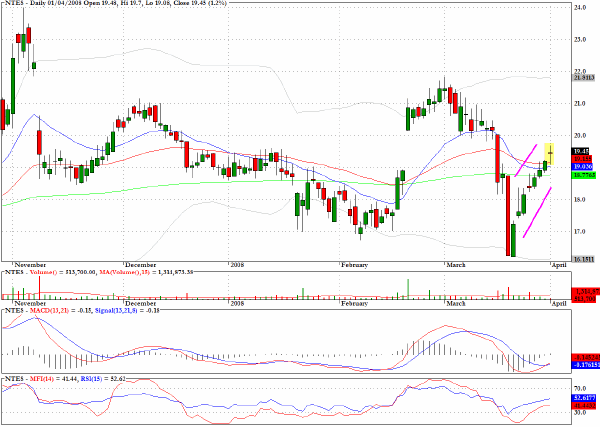
NetEase.com (NTES) could have reached the zenith within an upwards ascending channel as denoted by the doji star formation and miniscule volume in yesterday's session.
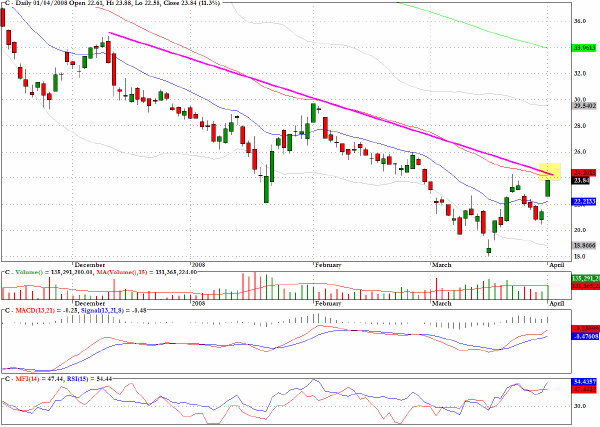
Citigroup (C) rallied exactly to resistance at the downward trendline through multi-month highs and the 50-day EMA.
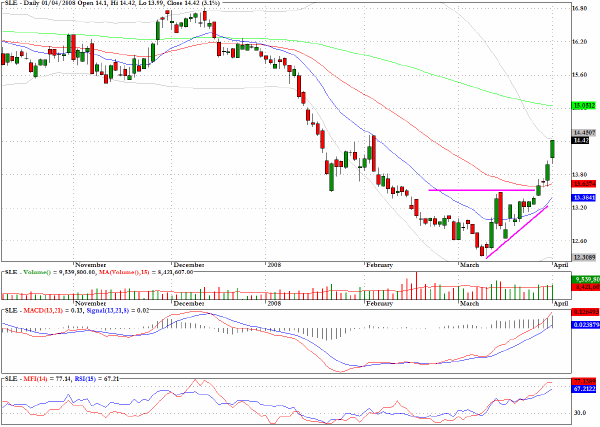
Sara Lee (SLE), recently recommended in my weekend newsletter, shows how one of my favorite patterns - the ascending wedge often precedes powerful breakouts.
Clive Corcoran is the publisher of TradeWithForm.com, which provides daily analysis and commentary on the US stock market. He specializes in market neutral investing and and is currently working on a book about the benefits of trading with long/short strategies, which is scheduled for publication later this year.
Disclaimer
The purpose of this article is to offer you the chance to review the trading methodology, risk reduction strategies and portfolio construction techniques described at tradewithform.com. There is no guarantee that the trading strategies advocated will be profitable. Moreover, there is a risk that following these strategies will lead to loss of capital. Past results are no guarantee of future results. Trading stocks and CFD's can yield large rewards, but also has large potential risks. Trading with leverage can be especially risky. You should be fully aware of the risks of trading in the capital markets. You are strongly advised not to trade with capital.
|