| The McMillan Options Strategist Weekly |
| By Lawrence G. McMillan |
Published
04/4/2008
|
Options
|
Unrated
|
|
|
|
The McMillan Options Strategist Weekly
The broad stock market has a much more positive technical background. Our intermediate-term indicators are positive and on official buy signals. They had slipped some last week but never rolled over to sell signals. Then this week's strong rally brought them back from the brink, and they remain positive.

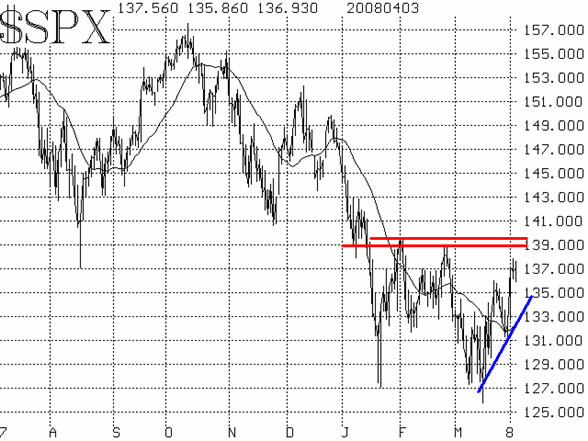
The $SPX chart has, in some respects, become muddled. But its general trend is now up, so that is positive. $SPX sliced back and forth through supposed support and resistance levels between 1320 and 1340 several times in the last two weeks. Thus, those levels are no longer significant as support or resistance. However, the chart clearly shows a higher high, higher low pattern, as marked in Figure 1. This is the sort of thing that is necessary as the first step towards building a lasting uptrend. This pattern remains positive as long as $SPX remains above the uptrend (blue) line on the chart. On the cautionary side, there remains heavy resistance at 1390-1400.

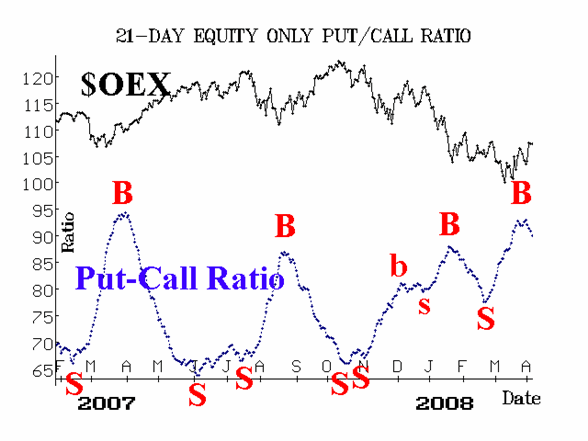
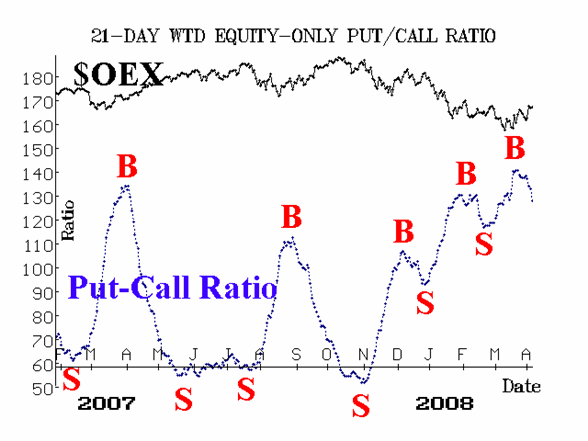
The equity-only put-call ratios had flirted with new highs at the end of last week, but have since backed off and are trending downward again. Thus, they are on (re)confirmed buy signals. These put-call ratios are one of our most trustworthy and long-term indicators.

Market breadth has been relatively strong over the past few weeks. Last week's decline was accompanied by only modestly negative breadth. Breadth strengthened on this week's rally and has now moved to overbought status. That is bullish, as long as breadth continues to expand.

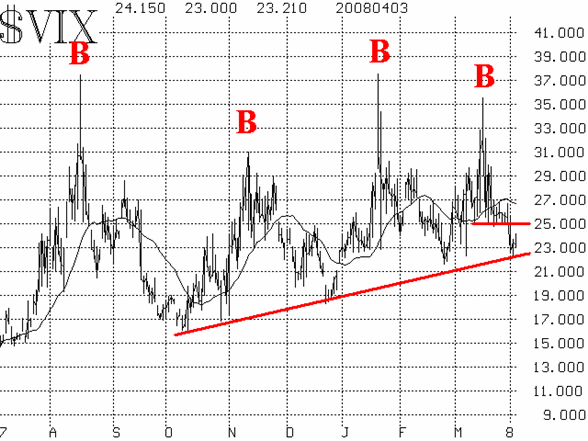
Finally, the volatility indices are bullish as well. They were the first to give intermediate-term buy signals, with their spike peaks back in mid-March (see Figure 4). However, $VIX had recently stalled near 25, but this week's drop below that level (re)confirmed the buy signals here as well.
In summary, the bears had a chance to regain control of this market last week, when $SPX declined about 50 points (from 1360 to 1310). However, none of the intermediate-term indicators rolled over to sell signals, which was a bullish divergence. And their refusal to do so was justified this week when prices moved higher again. So, at a minimum, we expect $SPX to test the 1390-1400 level. If it can close above there, a much stronger rally can take place.
But does this mean the bear market is over, and we can load up on bullish positions? Not really, because there was considerable damage done during the January and March declines, and it would not be out of the question to have yet another retest of the lows near $SPX 1260 -- much as there were three retests of the lows at the end of the 2000-2003 bear market. But for now, enjoy the bullish picture that has emerged.
Lawrence G. McMillan is the author of two best selling books on options, including Options as a Strategic Investment, recognized as essential resources for any serious option trader's library.
|