| Corcoran Technical Trading Patterns for April 7 |
| By Clive Corcoran |
Published
04/7/2008
|
Stocks
|
Unrated
|
|
|
|
Corcoran Technical Trading Patterns for April 7
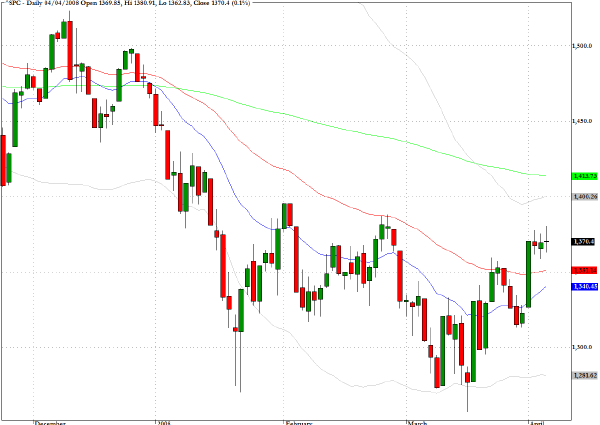
The S&P 500 (^SPC) recorded its third consecutive spinning top/doji star formation following last Tuesday's surge. There are obvious cross currents in the current environment that could present obstacles to decisive progress this week. While I still am targeting 1415, there could be some shakeout behavior in coming sessions.
The economic data continues to be weaker than contended by many perennial enthusiasts and advocates of the short and shallow recession hypothesis. There certainly has been a seismic shift in sentiment regarding the financials since the Fed’s decision to effectively use the public balance sheet to underwrite huge tranches of structured credit products. But there does seem to be a rather cavalier and optimistic assumption that the bottom is in sight for the Main Street economy as well.
In general terms, what I would be looking for in the next few weeks and months are signs that there is broad-based accumulation taking place by the traditional asset managers such as pension funds and long-only mutual funds. If the recovery is being largely driven by alternative asset managers such as the large hedge funds (as I suspect), there is a better than 50/50 chance that we will falter at critical overhead resistance levels such as the 1455 area on the S&P 500. It would not require too much imagination to see that a new bout of selling could easily gather pace from any or all of the following – severe deterioration in the economic data, weakness in Asia as the Olympics euphoria begins to fade, or a hangover following the present celebratory mood in the financials. So my central contention is that until we have clear technical evidence that we have moved beyond a bear market rally there is always a distinct possibility that we could eventually take out the March lows.
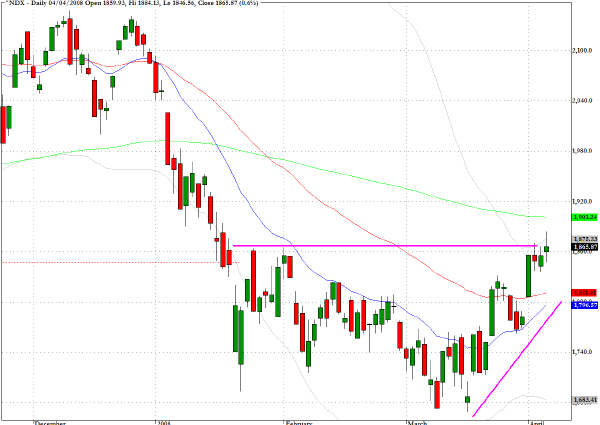
The Nasdaq 100 (^NDX) closed Friday's session with a spinning top formation that could portend some hesitant behavior in coming sessions. The index has approached its 200-day EMA ahead of the S&P 500 and came to rest at the end of a watershed week at a chart level, between 1860 and 1900, where there is a likelihood of price congestion and consolidation.
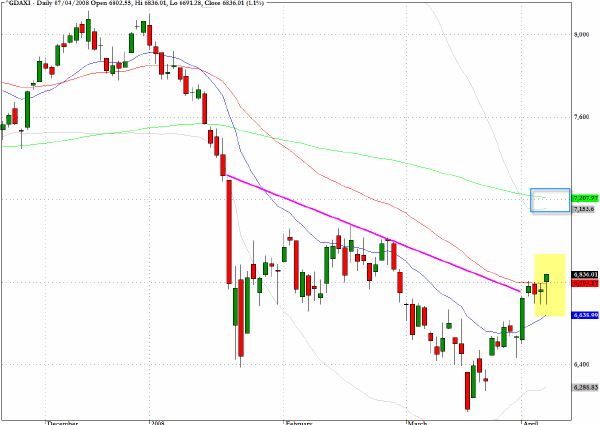
The chart below of Germany's Dax index (^GDAXI) shows the price action for the current session inserted as this is being written. The index has finally penetrated the 6800 level and in line with many other indices the next feasible target will be the 200-day EMA at 7200. We should not underestimate the task that lies ahead as the European markets are facing a central bank that, at least at present, seems to be far less obsequious than the Federal Reserve.
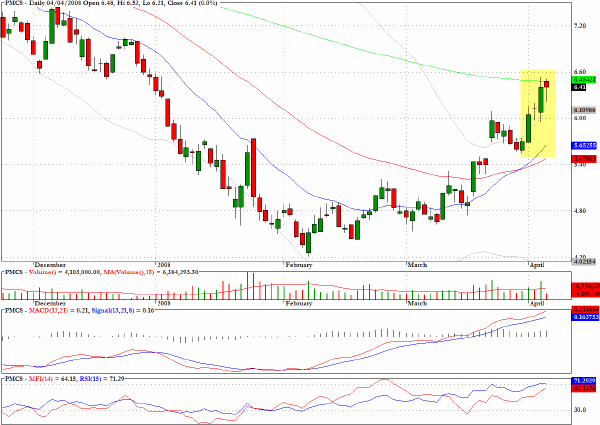
Recommended in last Monday's commentary, PMC Sierra (PMCS) returned more than 13%, but the stock could be expected to consolidate gains as it tagged the 200-day EMA in Friday's session.
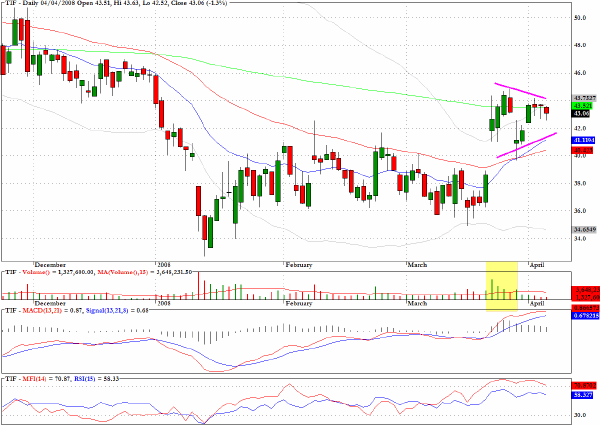
Tiffany (TIF) has a bullish pennant formation.
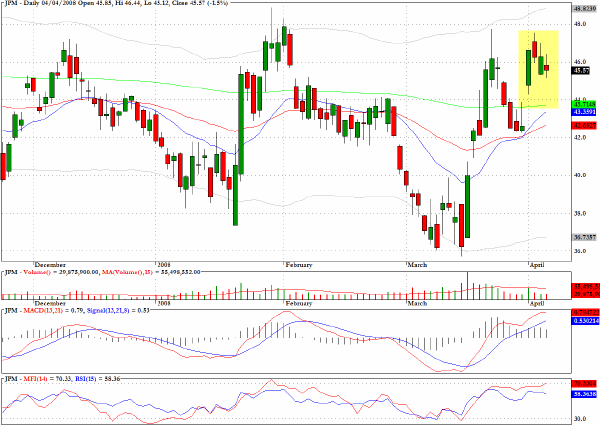
JP Morgan (JPM) exhibits one of the more reliable bullish continuation patterns.
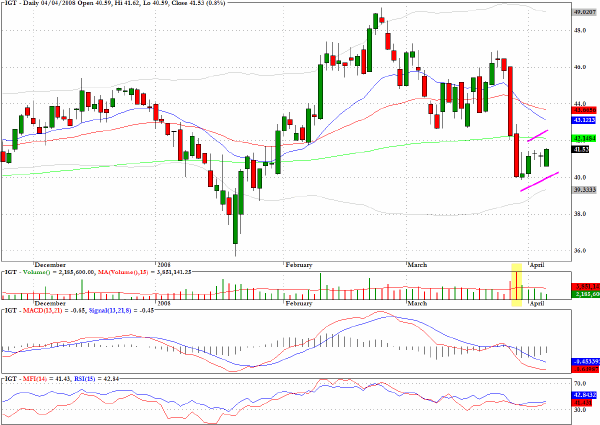
International Game Technology (IGT) may well encounter price rejection as it moves within a bear flag and approaches key moving average resistance.
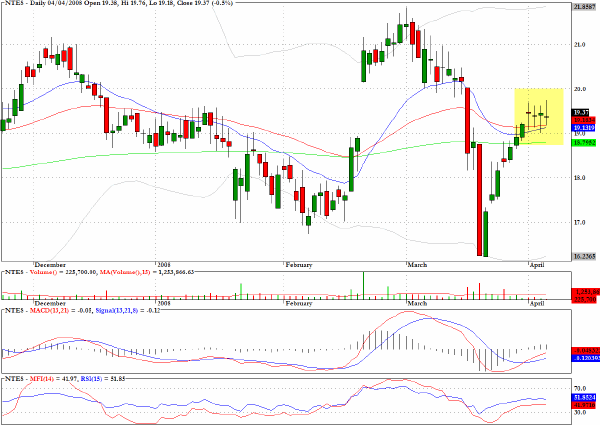
NetEase.com (NTES) appears vulnerable within a bearish pullback pattern.
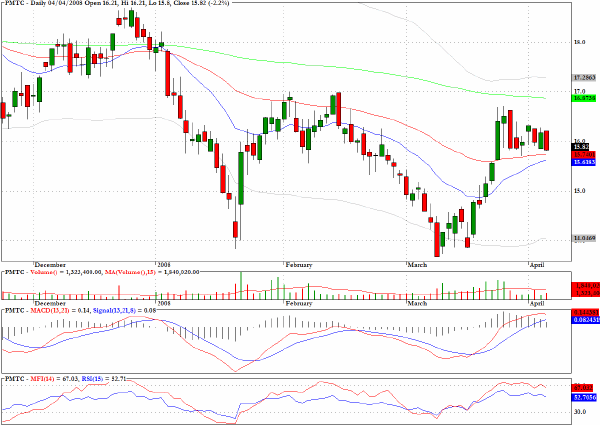
Parametric Technology (PMTC) is at a potential breakaway level where there is a flag like formation but there is a hurdle to be jumped with the 200-day EMA just above current levels and some evidence that momentum and money flow are fading. I would be looking at evidence during this week for which way the break is going to manifest itself.
Clive Corcoran is the publisher of TradeWithForm.com, which provides daily analysis and commentary on the US stock market. He specializes in market neutral investing and and is currently working on a book about the benefits of trading with long/short strategies, which is scheduled for publication later this year.
Disclaimer
The purpose of this article is to offer you the chance to review the trading methodology, risk reduction strategies and portfolio construction techniques described at tradewithform.com. There is no guarantee that the trading strategies advocated will be profitable. Moreover, there is a risk that following these strategies will lead to loss of capital. Past results are no guarantee of future results. Trading stocks and CFD's can yield large rewards, but also has large potential risks. Trading with leverage can be especially risky. You should be fully aware of the risks of trading in the capital markets. You are strongly advised not to trade with capital.
|