| Getting the Russell 2000 ETF (IWM) |
| By Mike Paulenoff |
Published
04/8/2008
|
Stocks
|
Unrated
|
|
|
|
Getting the Russell 2000 ETF (IWM)
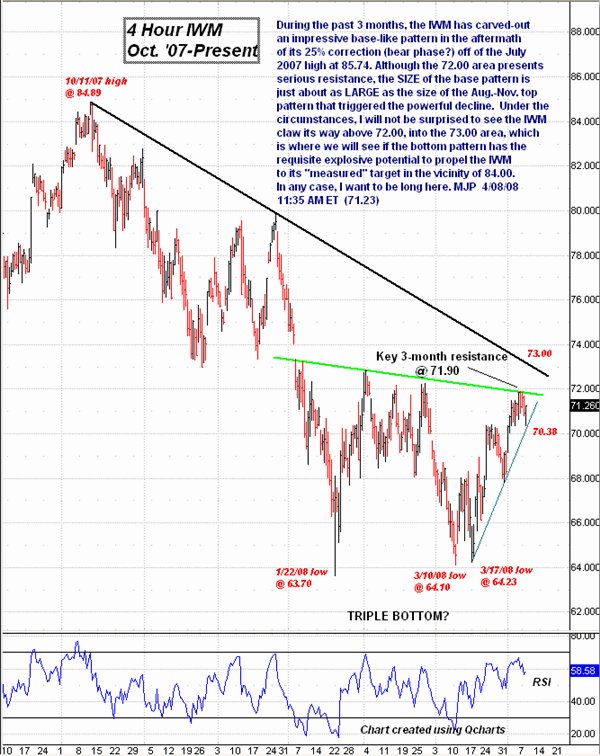
During the past three months, the Russell 2000 Small-Cap ETF (IWM) has carved out an impressive base-like pattern in the aftermath of its 25% correction off of the July 2007 high at 85.74. Although the 72.00 area represents serious resistance, the size of the base pattern is just about as large as the size of the August-November top pattern that triggered the powerful decline. Under the circumstances, I will not be surprised to see the IWM claws its way above 72.00 into the 73.00 area, which is where we will see if the bottom pattern has the requisite explosive potential to propel the IWM to its "measured" target in the vicinity of 84.00. In any case, I want to be long here.

Mike Paulenoff is a 26-year veteran of the financial markets and author of MPTrader.com, a real-time diary of his technical chart analysis and trading alerts on all major markets. For more of Mike Paulenoff, sign up for a free 15-Day trial to his MPTrader Diary by clicking here.
|