| The McMillan Options Strategist Weekly |
| By Lawrence G. McMillan |
Published
04/11/2008
|
Options
|
Unrated
|
|
|
|
The McMillan Options Strategist Weekly
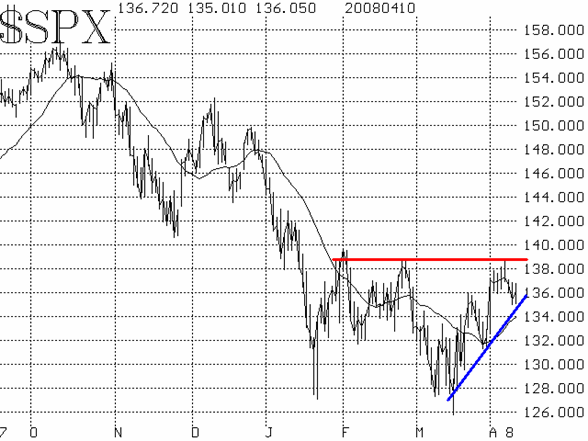
The strong upside breakout by the broad stock market on April 1 propelled $SPX (and other indices) to rally to resistance levels. That resistance has proven to be formidable, and the indices have fallen back from there. For $SPX, this resistance is the 1390-1400 area, while for the Dow, it is 12,800. Until that is overcome, there can be no new bull market.

Meanwhile, the budding uptrend in $SPX that began with the March lows, has matured into a series of higher highs and higher lows. As long as this remains intact, the chart of $SPX (FIg. 1) can be given a bullish interpretation. Something will have to give soon, though, for the resistance level and the uptrend are destined to meet shortly, at the current rate.

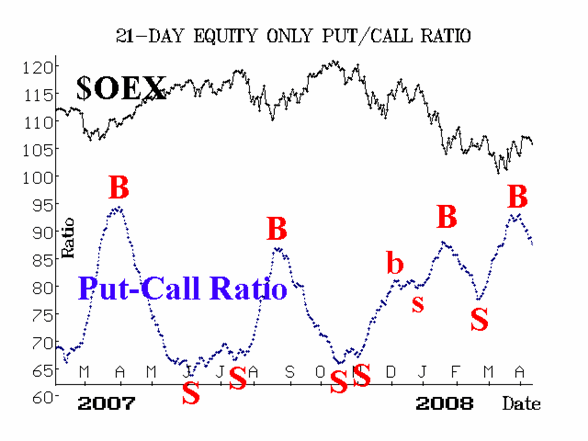
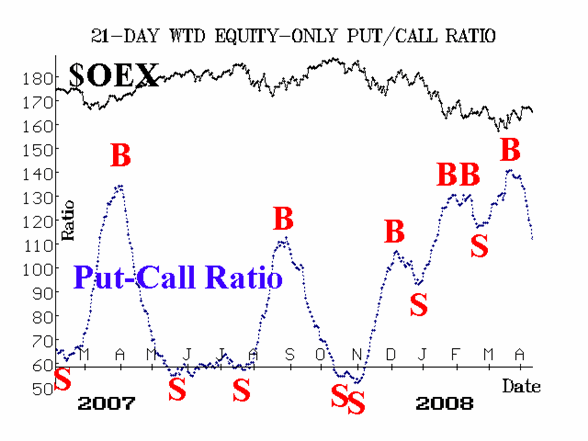
The equity-only put-call ratios remain on buy signals (Figs 2 & 3). They will do so as long as the ratios continue to decline on their charts. These are strong, intermediate-term buy signals from indicators with a stellar track record.

All of our indicators had been bullish to one degree or another for a couple of weeks now. However, the first set of sell signals has arisen from breadth -- just this week. Last year, we wouldn't have given much thought to a leading breadth signal, but in recent months, these signals have been strong and accurate. So, this indicates some caution should be observed now.

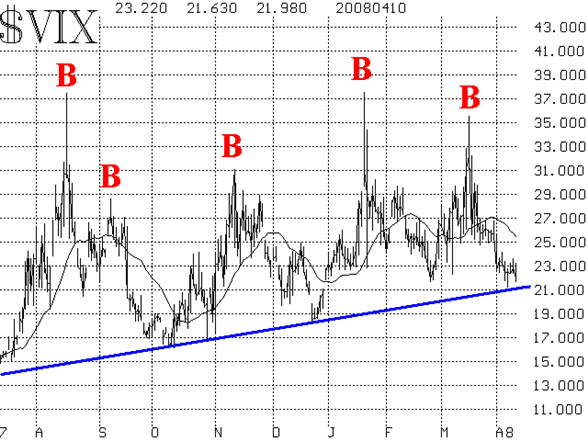
Finally, the volatility indices ($VIX and $VXO) continue to remain subdued. Both are still in downtrends, and that is bullish.
In summary, the indicators are mixed. The equity-only put-call ratios are clearly bullish, while the breadth is clearly negative, and $VIX is in a downtrend (bullish). Finally, even the $SPX chart itself has a conflict arising from bearish overhead resistance as measured against the tentatively bullish uptrend that has been in place since the March lows.
Lawrence G. McMillan is the author of two best selling books on options, including Options as a Strategic Investment, recognized as essential resources for any serious option trader's library.
|