| Stock Market Rally Not Overextended? |
| By Price Headley |
Published
04/12/2008
|
Stocks
|
Unrated
|
|
|
|
Stock Market Rally Not Overextended?
Over the last few weeks, the market has seen its typical ups and downs, but by in large, it has seen gains. As Thursday's closing bell, the market had posted gains to the tune of 7.3% from a month ago according to the SP500. After General Electric's earnings surprise on Friday morning, the market may give back some of those gains before the close. How do you know when the market trend is changing from bullish to bearish?
I use a hundreds of tools to manage my trading portfolio. They're all useful, but understanding the overall market trend may be most useful. I look at sentiment indicators as leading indicators for the market. Our four main indicators are RYDEX, VIX, CBOE Equity Put/Call ratio, and ISE Equity Call/Put ratio. They help us determine whether these big market moves are retests or trend reversals. The RYDEX is based on the non-penalized money flow between certain RYDEX funds that represent the bullishness or bearishness of investors. We look towards the VIX as a leading indicator based on extremes. The put and call ratios are both used as contrarian indicators meaning, when an extreme amount of calls are in bought a bearish reversal is on the horizon and vice versa.
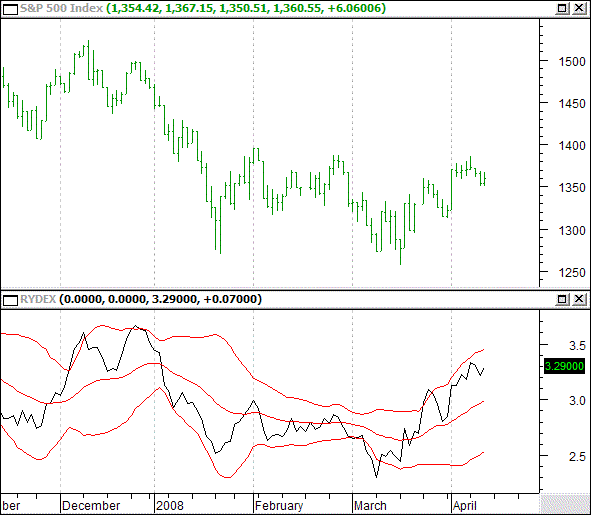
The RYDEX chart below shows a strong steady climb over the last month. Historically, there are no absolute values in the RYDEX that spur reversals; it's the relative extremes that spur reversals. We can quantify those extremes by using Bollinger bands with two standard deviations, when market participants' sentiment spikes to extremes it is probable for a return to normalcy. Take a look at the RYDEX below, the uptrend has remained orderly and inside the upper Bollinger bands thus providing a sustainable uptrend. If this type of trend can be confirmed from our other indicators, we can generate actionable advice.
RYDEX DAILY

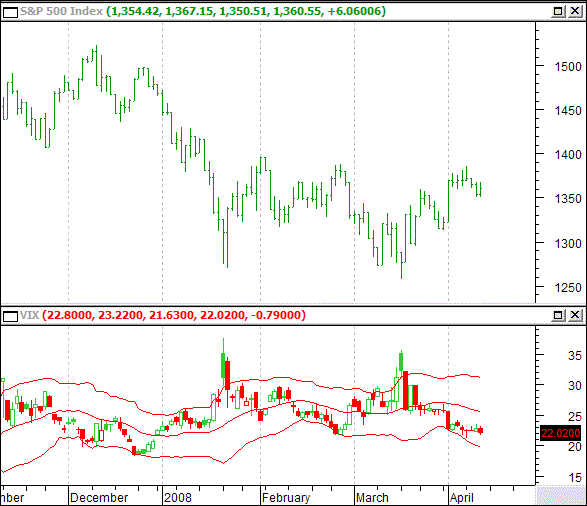
Take a minute to review the VIX below you'll see the relative absence of volatility over the last several days. The bottom line with the VIX is that is supports the RYDEX in that the decline has yet to show any extreme level as quantified by the lower Bollinger band. Just like in the RYDEX, we'll wait for a strong move down sending the VIX into extremely low levels-that will prime the next major downturn.
VIX DAILY

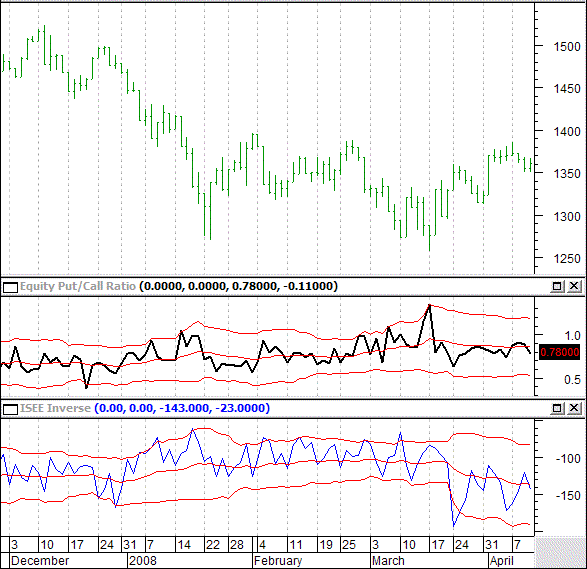
Finally, we take a look at our last chart for signals to find support for the VIX and the RYDEX. What we're looking for here are not so much trends in either ratio, but rather independent spikes outside the Bollingers. The last signal on the EPCR (Equity Put/Call) was the highest reading in the measures history, which dates back to the early 90s. That meant there were more puts purchased relative to calls (1.35 ratio) that at any other time. That day targeted the last market bottom-bearishness reached an extreme and a reversal started the next day.
CBOE Equity Put/Call and ISE Call/Put Inverse

Based on Thursday's close, we are not seeing outright signals that indicate the current bullish trend is overextended. In fact, the sell-off here on Friday morning may be the next retest place to increase your bullish positions.
Price Headley is the founder and chief analyst of BigTrends.com.
|