| Weekly Outlook in the Stock Market |
| By Price Headley |
Published
04/13/2008
|
Stocks
|
Unrated
|
|
|
|
Weekly Outlook in the Stock Market
NASDAQ Composite
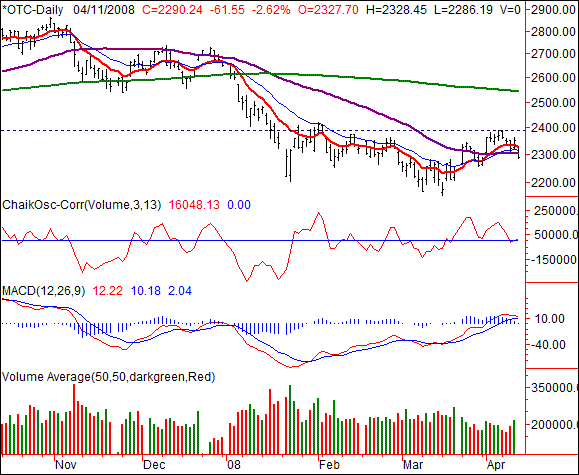
The NASDAQ's 2.62% tumble on Friday (-61.55 points) left it at 2290.24. For the week, that meant a 3.41% loss (-80.74 points), and a likely kick-start to another bearish leg.
There's one stark reality that stands out on this chart. The NASDAQ's cross back under the 50-day moving average line (purple). Though we still need confirmation (as in a lower close) to clinch the signal, this is cause for bearish concern. There's something else though.
Several weeks ago we discussed looking out for a very specific scenario. One of the things we had not seen since the tumble started in December was the 10-day line (red) crossing under the 20-day line (blue). The shorter line crossed under the longer one before they both fell under the 200-day moving average line (green).
We were also on the lookout for the 10/20-day lines to cross under the 50-day line. Why? Like the 10/20-day line cross, we haven't yet seen this while all three have been below the 200-day average.
So what? We're getting the short-term (10- and 20-day) moving average lines and the intermediate-term (20- and 50-day) moving average indicators both into bearish positions (or directions) would be the first time we've started new bearish momentum with all three in bearish alignment.
We saw all three in a bearish trend during Q1, but they didn't start new bearish momentum that way the 200-day line was still rising at that point. If there was going to be a full-blown recovery, the rebound that started in March was the market's best shot. As of Friday, the bulls lost it. They have a shot at taking control again early in the coming week, but as of right now the next bearish leg appears to be starting. We're also about a day away from a bearish MACD cross.
NASDAQ Composite Chart - Daily

S&P 500
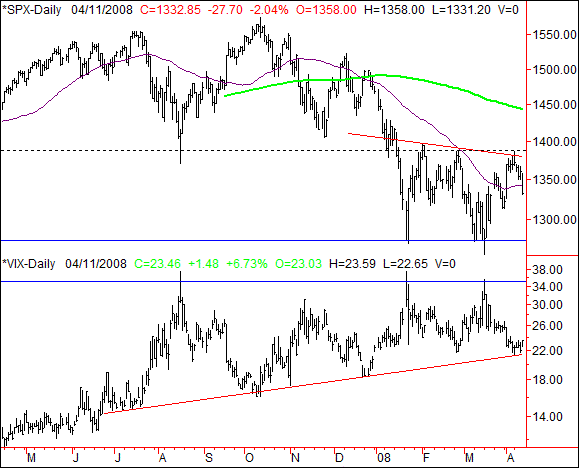
The loss of 2.04% (-27.7 points) on Friday left the S&P 500 at 1332.85 for the week. That was 2.74% (-37.55 points) under the previous week's close, and left the index heading lower.
Monday's peak of 1386 essentially matched two key resistance lines. The first is horizontal resistance at 1388 (dashed) from February, and the second is the gently falling resistance line (red) that tags that peak as well as January's. It's not an exact science.
Given how the ceiling stepped up to the plate again, we can reasonably expect the previous result to also play out. That result? A trip back down to this year's lows around 1273. That's not a guarantee -- just likelihood.
In the meantime we've re-plotted the VIX, with a slight change to its support line -- a change that became apparent this week. Basically, we lowered it to accommodate this week's lows. Of course, they were largely deafened by the fact that the VIX stopped falling and started to rise. Based on what we see right now, we may well see the VIX move back up to its recent ceiling around 35 (blue), which is bearish for stocks.
S&P 500 Chart - Daily

Dow Jones Industrials
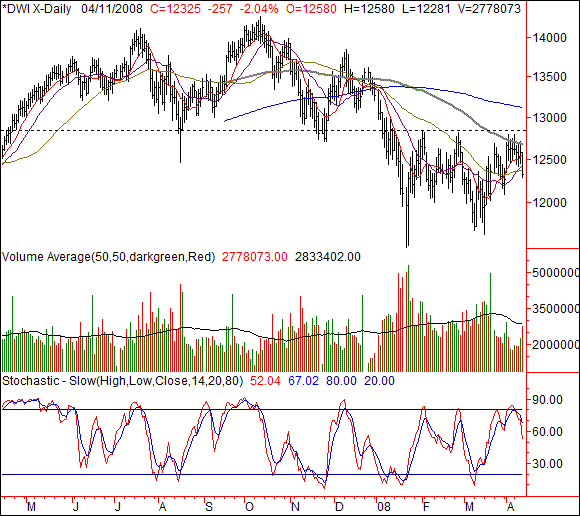
The Dow's close at 12,325 on Friday was the result of the 2.04% (-257 points) selloff. On a weekly basis, the blue chip index sank 284 points, or 2.25%.
The Dow's chart looks a heck of a lot like the S&P 500's, so no need to rehash the whole thing again. Just keep an eye on past highs and lows as potential support and resistance.
The only thing we'll add here is to not get too excited if the bulls come back strong on Monday. Stocks fell sharply this past week -- particularly on Friday. That could inspire a brief rally fueled by bargain hunting. The question is longevity. As long as the Dow doesn't get back above the 100 day average (grey) at 12,672, the trend will still technically be bearish.
Dow Jones Industrials Chart - Daily

Price Headley is the founder and chief analyst of BigTrends.com.
|