| Corcoran Technical Trading Patterns for April 14 |
| By Clive Corcoran |
Published
04/14/2008
|
Stocks
|
Unrated
|
|
|
|
Corcoran Technical Trading Patterns for April 14
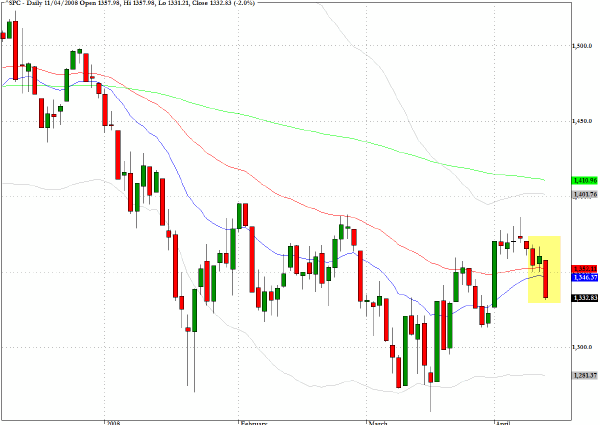
After spending several sessions after the April 1 surge biding their time in a holding pattern, the short side were energized to move off the sidelines by the troubling numbers from GE. Looking at the daily chart for the S&P 500 (^SPC) the breakdown below both the 20- and 50-day EMA's that took place at the end of last week may well have motivated the bears to limber up for a re-test of the March low.
There are however some divergences that I comment on below which could be suggesting that, despite the almost relentlessly gloomy economic news, there are many asset managers that are cautiously looking to add to portfolios on the long side.
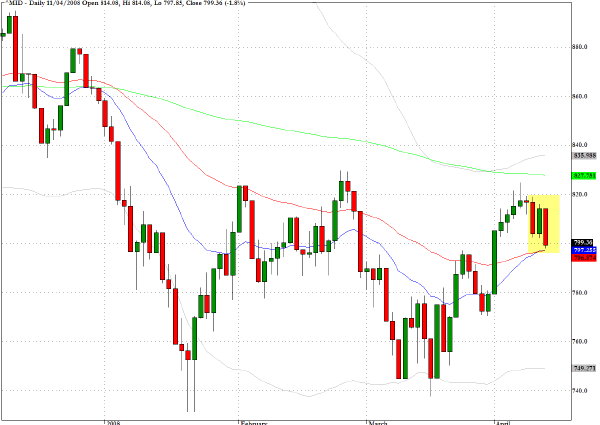
The S&P 400 Midcap (^MID) tells a rather different story to its more widely followed sibling. The index came to rest on Friday above the convergence of two key moving averages and still in contention with the 800 level. The interesting divergence between the larger caps and the midcaps is one indicator that I shall be monitoring this week to gauge the potential for follow through on the downside.
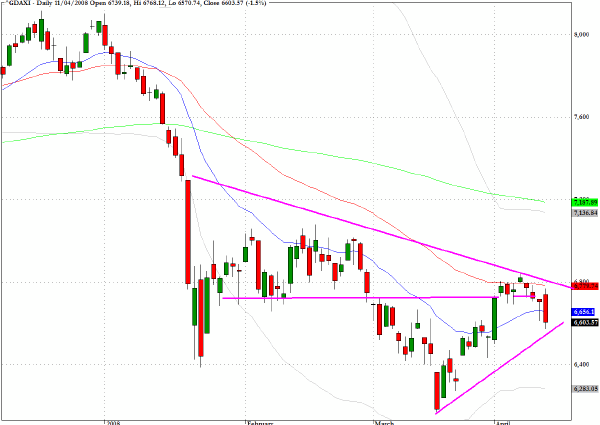
Germany's DAX index (^GDAXI) reveals an elongated triangular pattern that dates back to mid-January. The 6800 level has proved to be a significant overhead hurdle and I shall be watching this week to see whether the 6400 level can provide sustainable support. As with all extended triangles this pattern is calling out for some form of resolution in the not too distant future.
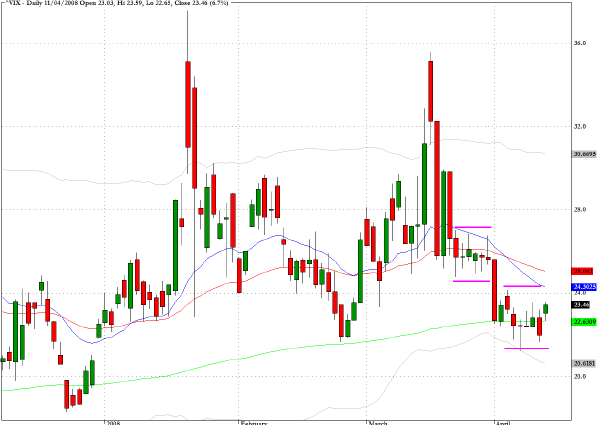
Despite Friday's selloff, the CBOE Volatility Index (^VIX) is still behaving in a far more sedate manner than it did during the January and March "crises". The 200-day EMA has acted as an attractor since early April for the market's estimation of implied volatility and the two channels indicated show that a lot of the fear and expectation of turbulence that was being expressed in January and mid March has dissipated.
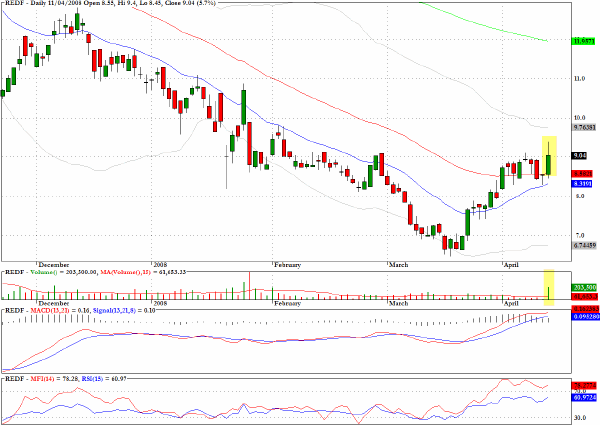
Rediff.com (REDF), the Indian online content provider, managed to move ahead by more than five percent on triple its average daily volume, and a continuation is to be expected in future sessions.
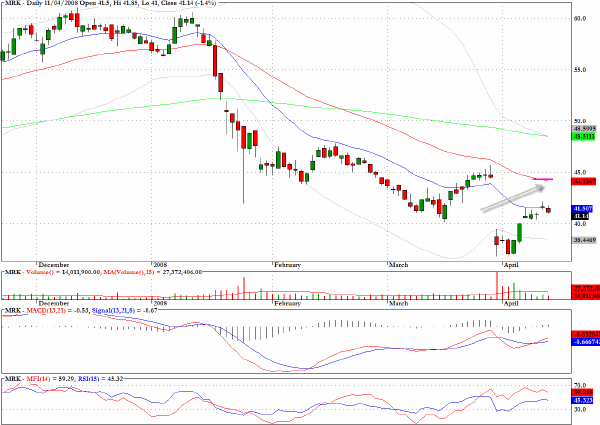
Merck (MRK) looks good on the short side as it comes nearer towards the $45 level.
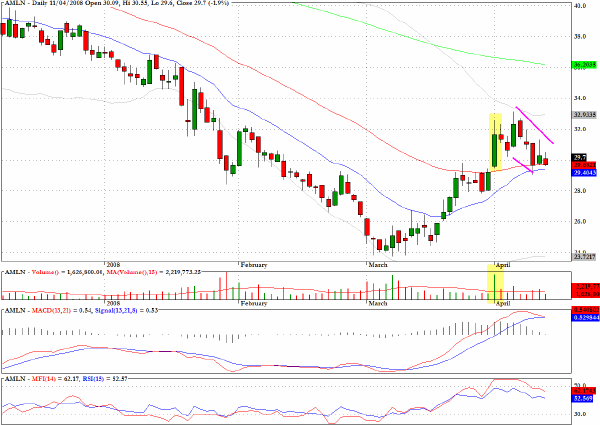
I would be looking at a move upwards by Amylin Pharmaceuticals (AMLN) towards the 200-day EMA.
Clive Corcoran is the publisher of TradeWithForm.com, which provides daily analysis and commentary on the US stock market. He specializes in market neutral investing and and is currently working on a book about the benefits of trading with long/short strategies, which is scheduled for publication later this year.
Disclaimer
The purpose of this article is to offer you the chance to review the trading methodology, risk reduction strategies and portfolio construction techniques described at tradewithform.com. There is no guarantee that the trading strategies advocated will be profitable. Moreover, there is a risk that following these strategies will lead to loss of capital. Past results are no guarantee of future results. Trading stocks and CFD's can yield large rewards, but also has large potential risks. Trading with leverage can be especially risky. You should be fully aware of the risks of trading in the capital markets. You are strongly advised not to trade with capital.
|