| Complacent Market Reaction |
| By Price Headley |
Published
04/14/2008
|
Stocks
|
Unrated
|
|
|
|
Complacent Market Reaction
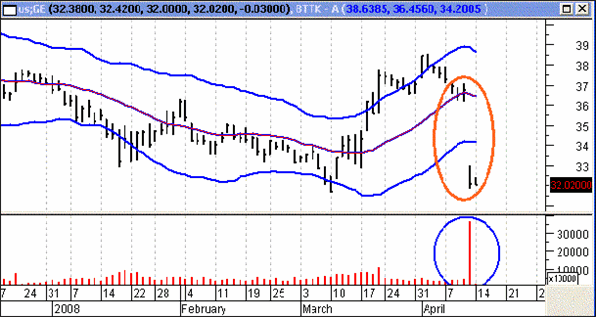
On Friday, General Electric (GE) released a shocking negative earnings report and future forecast. This market bellwether and mega-cap stock plummeted lower on the news, gapping down sharply and closing about 13% lower. Volume skyrocketed. This represented a loss of around $47 Billion in GE market capitalization, wiped out in one day. To put it into perspective, this loss in market cap is larger than the 2007 nominal GDP of the entire country of Ecuador or Belarus.
GENERAL ELECTRIC (GE) DAILY CHART W/VOLUME

The overall stock market has been hit by bad and worse fundamental and economic news on almost a daily basis lately. A financial credit crisis, record oil and commodity prices, and a pathetically-low dollar are just three of the recent negative economic news. It is almost as if, when things appear they can't get any worse, another shoe is dropped.
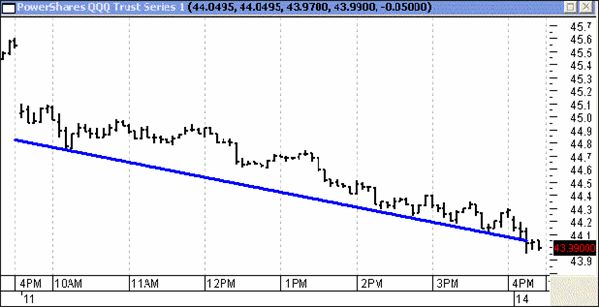
I found Friday's market performance and reaction to the GE news as interesting and unusual. The NASDAQ, as represented by the QQQQs, basically had an orderly, stair-step decline all day. There was no attempt to rally, and, more surprisingly, no panic sell-off ensued.
QQQQ INTRA-DAY CHART ON FRIDAY, APRIL 11, 2008

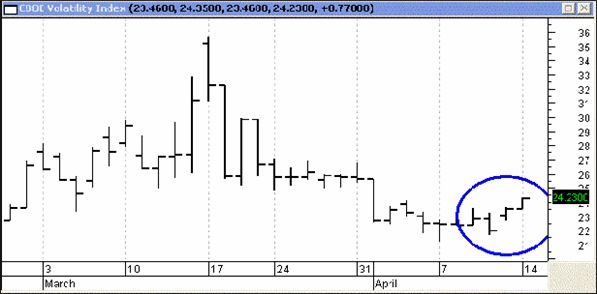
This lack of panic selling was also shown by the movement of the CBOE Volatility Index (VIX), which as you may be aware, shows the implied volatility of equity options. A spike in the VIX denotes option premiums are rapidly rising and generally means a panic/fear mode has set in.
One would expect a large spike in the VIX on a day when one of the most consistent and widely-held stocks experiences a historic decline. The chart below shows that, while the VIX has moved a bit higher in recent days, it has been far from a large spike upwards, which from our contrarian perspective is troubling, as it indicates complacency.
CBOE VOLATILITY INDEX (VIX), DAILY CHART

So, there is no doubt that Friday was an unusual day for the market. An extremely orderly sell-off was combined with a lack of panic selling or a reversal rally. To me, this does not set the stage for a market rally in coming weeks - in fact, I would expect a continuation of the recent sideways/downwards choppy trading range with volatility.
However on the flip-side, there is always the possibility that Friday's unusual action may represent the ultimate culmination of the almost-daily bad news. Traders may be so beaten down that one more piece of bad news does not have the negative effect that it should have. What makes this less likely is that we did not see a large spike of fear/panic that would precede a large market reversal.
The current drumbeat of bad news reminds me a bit of the 1997 and 1998 Asian and subsequent Russian Currency Crisis - however, in those scenarios, we reached a crescendo of bad news before resuming the underlying super-strong bull market uptrend. Since we do not appear to be in an overall U.S. bull market currently (in fact it appears the opposite), there is less likelihood of a breakout rally to the upside.
Price Headley is the founder and chief analyst of BigTrends.com.
|