| Corcoran Technical Trading Patterns for April 15 |
| By Clive Corcoran |
Published
04/15/2008
|
Stocks
|
Unrated
|
|
|
|
Corcoran Technical Trading Patterns for April 15
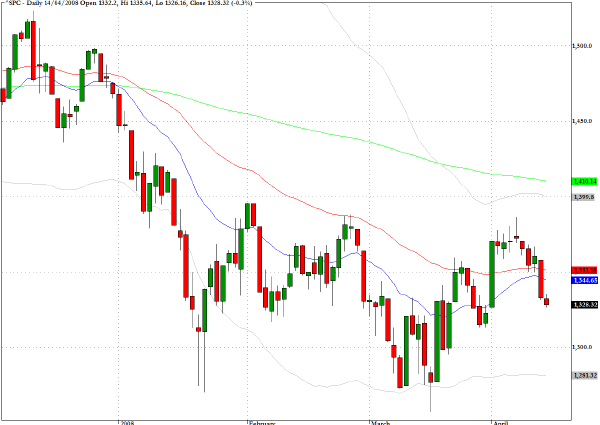
The S&P 500 (^SPC) registered another red candlestick yesterday but the intraday low remained within a whisker of the April 1 low.
All of the gains from that day's dramatic upward move, many of which could be attributed to a frantic scramble by the shorts to cover when UBS announced eye-watering writedowns, have now been given back. With bank earnings on the horizon again we may see yet another example of short sellers booking gains when the news is as gloomy as it is expected to be.
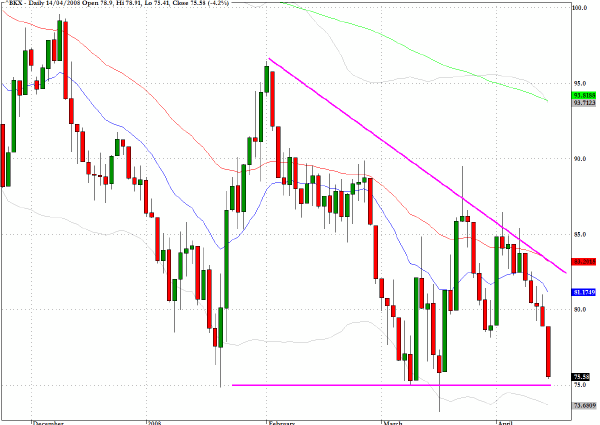
The index that I shall be focusing on for the remainder of this week is the banking index (^BKX) which has retreated to a fundamental level coinciding with January and March lows. The gravity of a test of this critical level is underlined by the descending wedge formation that is very much in evidence.
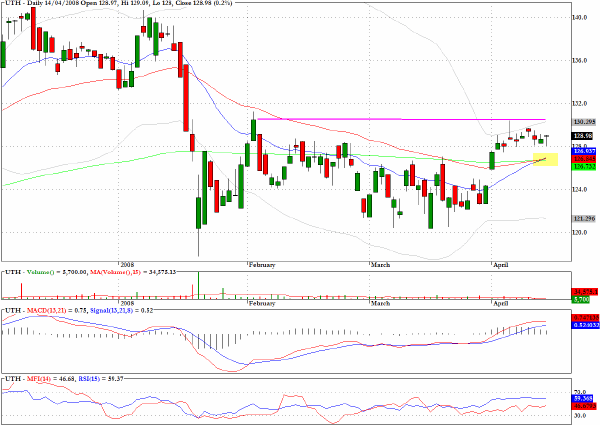
The exchange traded fund, UTH, which is one vehicle that tracks the utilities stocks, is in a consolidation pattern just below a potential breakout level. There is strong support indicated just below the closing price for the fund yesterday at the intersection of all three moving averages with both of the shorter duration averages moving above the 200-day EMA.
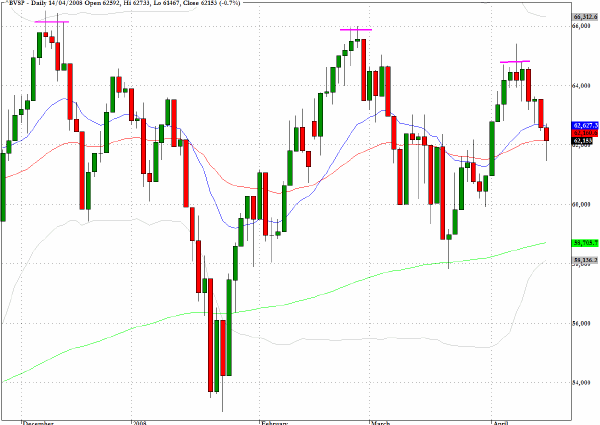
The Bovespa index in Brazil (^BVSP) is at a critical level and if the index breaks below the 50-day EMA, in the context of the succession of lower highs since late last year, we should expect a retreat to the 200-day EMA in the near term.
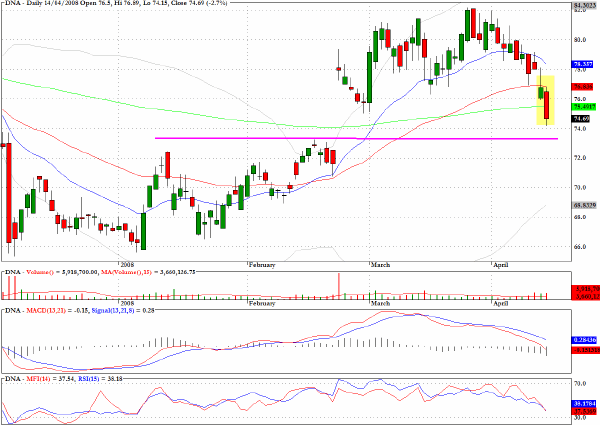
Genentech (DNA) dropped below the 200-day EMA on an uptick in volume and now faces the test of the gap up that took place in mid-February.
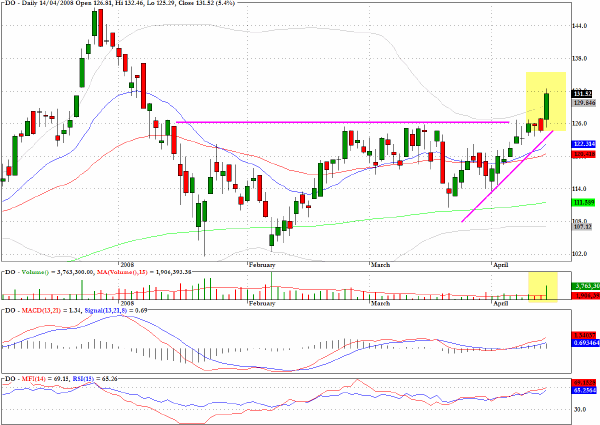
Diamond Offshore Drilling (DO) is a good example of one of my favorite patterns - the upward wedge pattern - and the breakout was accompanied by more than twice the average daily volume.
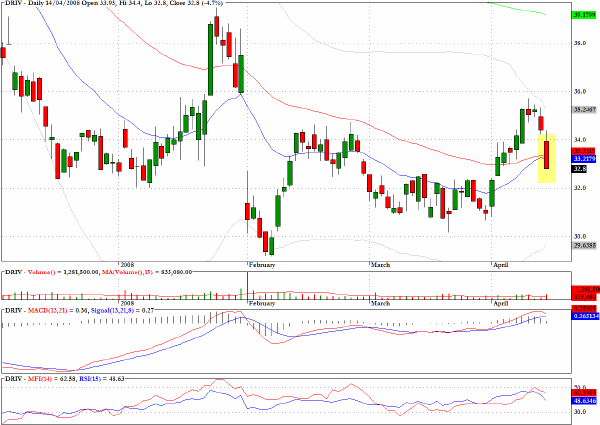
Digital River (DRIV) looks to be headed down to probe potential support at the February lows.
Clive Corcoran is the publisher of TradeWithForm.com, which provides daily analysis and commentary on the US stock market. He specializes in market neutral investing and and is currently working on a book about the benefits of trading with long/short strategies, which is scheduled for publication later this year.
Disclaimer
The purpose of this article is to offer you the chance to review the trading methodology, risk reduction strategies and portfolio construction techniques described at tradewithform.com. There is no guarantee that the trading strategies advocated will be profitable. Moreover, there is a risk that following these strategies will lead to loss of capital. Past results are no guarantee of future results. Trading stocks and CFD's can yield large rewards, but also has large potential risks. Trading with leverage can be especially risky. You should be fully aware of the risks of trading in the capital markets. You are strongly advised not to trade with capital.
|