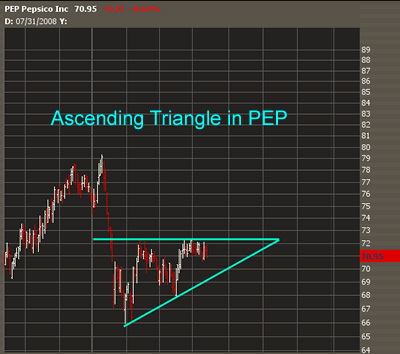
| Ascending Triangle in PepsiCo (PEP) |
| By Andy Swan |
Published
04/15/2008
|
Stocks
|
Unrated
|
|
|
|
Ascending Triangle in PepsiCo (PEP)
Over the last three months, PepsiCo Inc (PEP) has created a series of higher highs that look to be an ascending triangle. For this reversal pattern to be valid, PEP will have to break 72.50 on heavy upside volume. Based on the measured move, if a break occurs, it should signal a rally in PEP that should carry it to 78.00.
There's an interesting technical line on the 6-month chart in International Business Machines (IBM). The technical level started as uptrend support. Once support broke, IBM rode along the upward sloped support turned resistance line for about two months. The stock then broke back above the line, and it is once again acting as uptrend support.
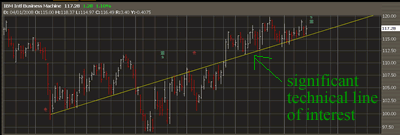
have not seen many technical lines that act similar to this one, and thought it was worth sharing. IBM reports earnings tomorrow, April 16th, after the market close. The stock is currently trading very close to the uptrend support line, indicating we may see a positive move in earnings. Regardless of the reaction to earnings in IBM, I will be paying close attention to this area of technical interest.
Andy Swan is co-founder and head trader for DaytradeTeam.com. To get all of Andy's day trading, swing trading, and options trading alerts in real time, subscribe to a one-week, all-inclusive trial membership to DaytradeTeam by clicking here.
|


 Free Festival of Traders Videos