|
A Mid-Week Look at the Market
S&P 500 Index
Last week, I mentioned the 1400 as being a big support/resistance level for the S&P 500 (SPX). I continue to think that level is important, both from a technical and a psychological level. The 1500 level is important, as well.
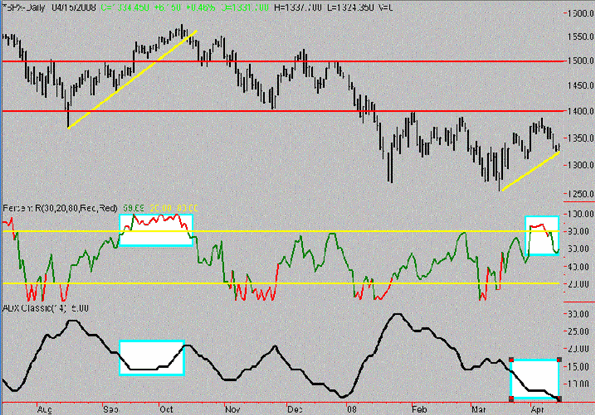
For this week's mid-week examination, I noticed an interesting pattern on the daily SPX chart. At first glance, the SPX March-April 2008 performance would appear very similar to the August-September 2007 performance, leading one to conclude there is roughly another month of outperformance by the Index. However, I think there are divergences in important technical indicators which make this rally not nearly as likely, in my opinion.
As you can see in the chart below, at roughly the midpoint of the August to October 2007 rally, the Percent R reading went into +80 territory, and stayed there for about a month while the SPX continued to rally, before beginning a longer downtrend. During the upside move, the SPX broke above the key 1500 level, only to return back below it on the downside.
While the current SPX pattern/trendline looks similar, you can see that the key Percent R reading has not remained in a +80 "overbought momentum" condition, which would indicate a continuing of the uptrend, in my view. In addition, the ADX line at the bottom of the graph, which indicates strength of underlying trend, is on a real basis lower than it was during the 2007 mini-rally. For a strong SPX rally to ensue, I would like to see Percent R sustain a move back above 80 and for the ADX to move sharply higher.
So while a continued SPX mini-rally is possible, I would not expect it to be strong and would expect it to face strong resistance at the 1400 level.
S&P 500 Index daily chart w/ Percent R, ADX

NASDAQ Composite
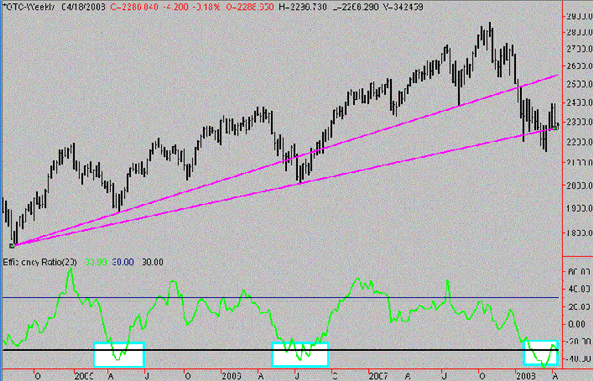
Let's take a look at a longer-term NASDAQ Composite Weekly chart covering about 3.5 years worth of data. What I see here is that the NASDAQ has established 2 longer term uptrend lines since a key bottom in late-2004. The first, sharper uptrend line was broken in mid-2006, but established a new low point for a lower, flatter trendline. We are currently hovering around that trendline, and have in fact broken slightly below it in recent months.
I would view the flattening out of this trendline as indicating a weakening of the longer-term uptrend. And a strong break below would not be surprising at all, although we may in fact rally from this semi-support in the near-term. I continue to view this Index as having limited, trading-range/choppy type movements in the foreseeable future, and if there is in fact a strong move in either direction, I would guess it to be to the downside.
A positive mitigating factor to this perceived weakening uptrend would be the Weekly reading of the Efficiency Ratio in the lower part of the chart. Readings below -30 in this indicator have been effective over the past few years as an Over-Sold timing device. However, the other two readings that preceded rallies were led by nice, sharp, short 1-4 week bottoms in the NASDAQ, while currently we are in a 10-14 week messy, choppy formation, as I see it, dampening the effects of this indicator.
NASDAQ Composite Weekly chart w/ Efficiency Ratio

CBOE Volatility Index
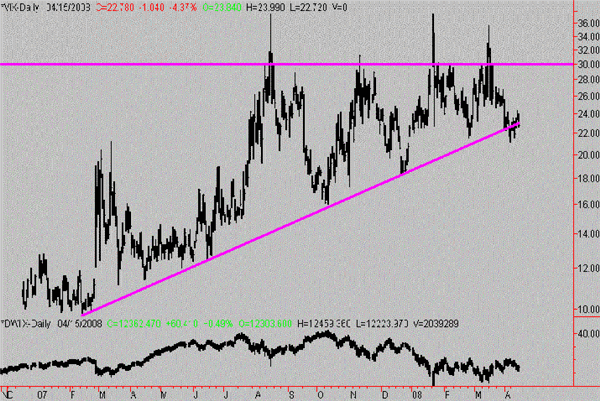
In last week's mid-week update, I mentioned that the CBOE Volatility Index (VIX) is at its bottom trendline support, and may be heading to a break lower, without any real reason for doing so, other than the normal Summer slowdown in volume and volatility in the marketplace. As contrarians, this indicates some complacency to us in the marketplace, especially given the terrible economic and fundamental news recently.
This week, I have gone back a little further on the chart, and noticed that we appear to be heading to an important "Inflection Point" on the VIX chart. This narrowing range with trendlines converging is a classic technical charting technique that usually precedes a large move in one direction or another.
I would be inclined to forecast that the next big move in the VIX will be to the downside, in part because of the normal Spring/Summer doldrums, and in part because the market has already digested so much bad fundamental and economic news, it may literally be 'fear-exhausted' and unable to ratchet up the panic level.
CBOE Volatility Index w/ Dow Jones Industrial Average

Price Headley is the founder and chief analyst of BigTrends.com.
|