| Corcoran Technical Trading Patterns for April 18 |
| By Clive Corcoran |
Published
04/18/2008
|
Stocks
|
Unrated
|
|
|
|
Corcoran Technical Trading Patterns for April 18
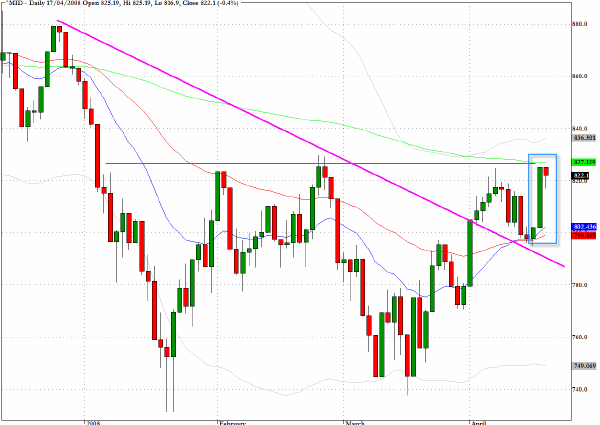
I have focused a lot this week on the chart for the S&P 400 Midcap index (^MID) because, for me at least, it is revealing the currently critical posture of US equities more clearly than the other indices. The big move up this week has requalified the April 1 breakout above the downward trendline through the highs since last December.
As noted yesterday the index rallied right up to its 200-day EMA, which most other broad indices in the US are still some distance from. There was a pause in yesterday's action (a hanging man candlestick) but going forward the index is now boxed in to a range between the 50-day EMA and the 200-day EMA, and at such an inflection point, that the market cannot much longer postpone which way the breakout is going to come.
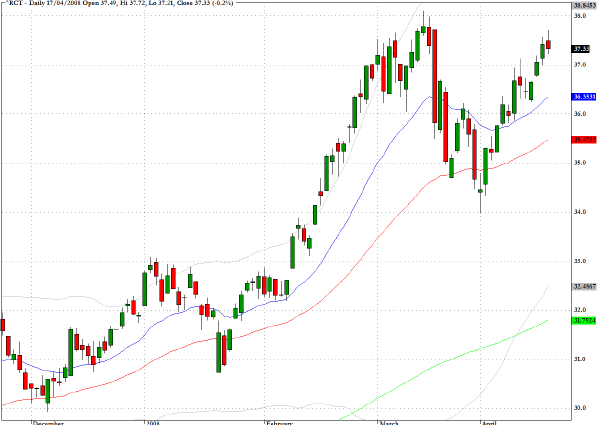
The cross currents visible in chart patterns of a wide range of different asset classes, part of the re-allocation process that was discussed yesterday and which is manifestly underway at present, appears to be reaching a turning point. The strength in the energy sector and across the commodities is pushing some markets towards their limits.
The Jim Rogers Commodity Index Index is the most diverse of the commodity indexes being calculated from 35 commodities from eleven international exchanges. The index is now approaching the peak levels seen during the Bear Stearns crisis in mid March and those hedge funds that are loading up again on commodities may be hoping that another ambush for the equity bulls has been set. The question for which I sense we are about to get our answer soon is - which has the most capacity to surprise at this point - another selloff in equities or a big rush to the exits from energy and other industrial commodities by over-leveraged hedge funds?
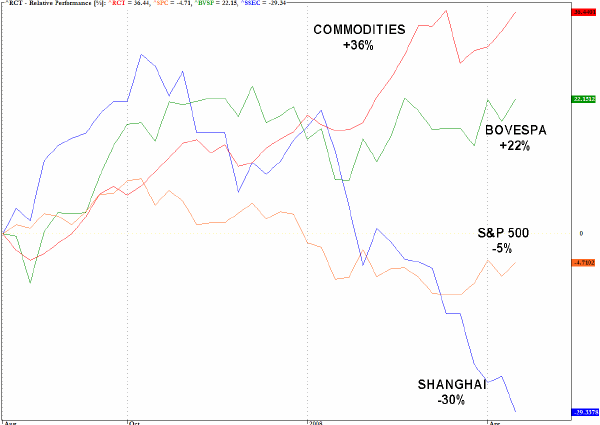
One of the charts that I intend to discuss this afternoon on CNBC's European Closing Bell measures the relative performance of several global assets since the onset of the so-called credit crunch that went into overdrive last August. Although there are inevitably simplifying assumptions in using such a broad brush approach, one of the more striking impressions is the incongruous behavior between the strength in the commodities and the bearish performance of the Shanghai market. Also, when placed in context, the gyrations of the S&P 500 seem remarkably subdued when compared to the volatility being experienced by hedge funds that have exposure to these other asset classes.
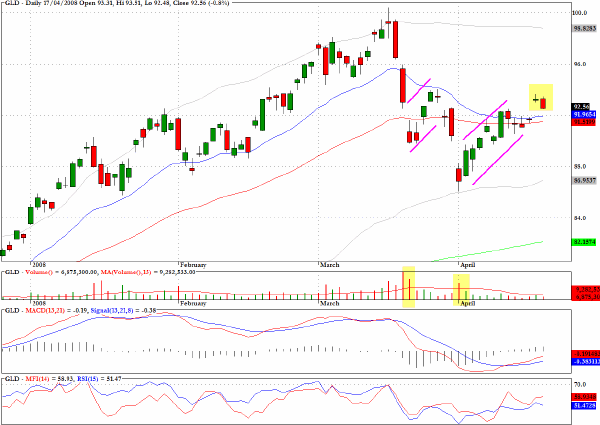
The exchange traded fund that tracks the price of gold is revealing clearly discernible, negative volume characteristics. The pattern is beginning to take on the form of a downward staircase that drops another step when the flag formations have run their course. The volume chart clearly shows that volume is accelerating on the downward moves and retreating noticeably during the recovery attempts.
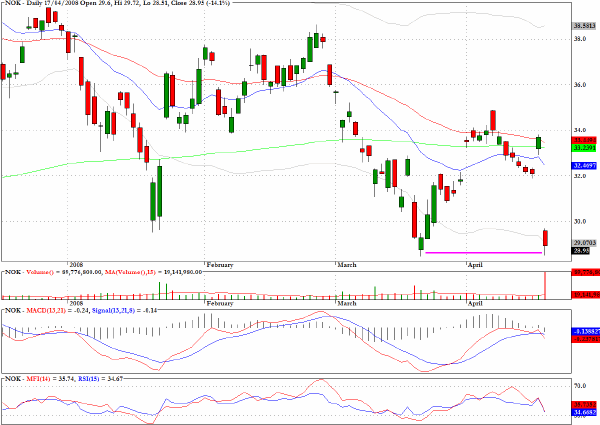
Yesterday's statements from Nokia (NOK), which has been a long standing favorite for fund managers, proved to be just a little too "realistic" in terms of the outlook.
The stock was clobbered when the company stated some obvious concerns about the likelihood of slowing global sales and the competitive threat from the iPhone. Both of these should hardly have been big surprises and according to the conventional wisdom they should already have been "discounted" by the market.
Although the "smart money", according to some pundits, has been recently showing an uncanny foresight in already discounting the impact of the recession and all of the writedowns from mortgage backed securities, it seems to have missed this one. The stock found support at the March lows and a pullback towards the $32 level seems probable.
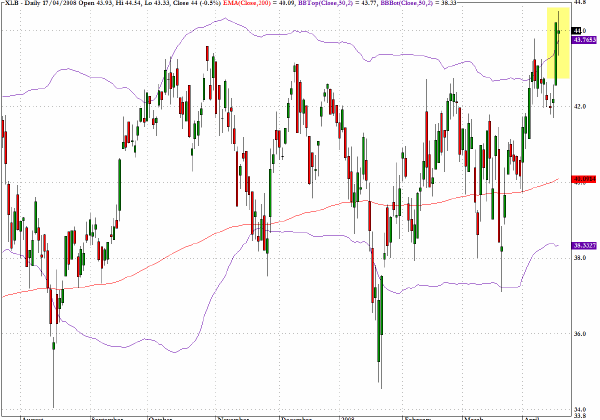
XLB, the Spider fund for the Material sector, reached a strong resistance level at the top of its range and above the 50-day upper volatility band. The chart formation underlines the rather critical levels that industrial commodities and global infrastructure plays have reached.
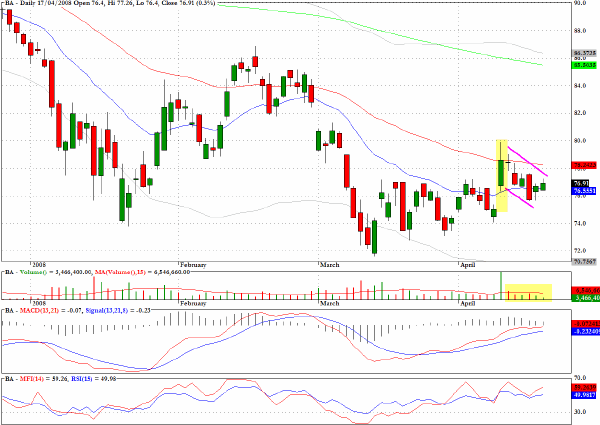
Boeing Corp (BA) has a classic bull flag in the making with the subdued volume during the pullback which adds emphasis to upward spike move from last week.
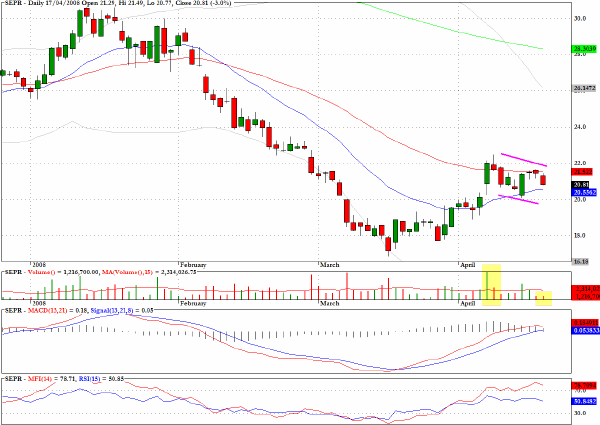
Sepracor (SEPR) along with Boeing has the required characteristics for potentially more bullish behavior following the recent pullback.
Clive Corcoran is the publisher of TradeWithForm.com, which provides daily analysis and commentary on the US stock market. He specializes in market neutral investing and and is currently working on a book about the benefits of trading with long/short strategies, which is scheduled for publication later this year.
Disclaimer
The purpose of this article is to offer you the chance to review the trading methodology, risk reduction strategies and portfolio construction techniques described at tradewithform.com. There is no guarantee that the trading strategies advocated will be profitable. Moreover, there is a risk that following these strategies will lead to loss of capital. Past results are no guarantee of future results. Trading stocks and CFD's can yield large rewards, but also has large potential risks. Trading with leverage can be especially risky. You should be fully aware of the risks of trading in the capital markets. You are strongly advised not to trade with capital.
|