| Wal-Mart's Classic Technical Breakout |
| By Price Headley |
Published
04/18/2008
|
Stocks
|
Unrated
|
|
|
|
Wal-Mart's Classic Technical Breakout
Retailing behemoth Wal-Mart (WMT) has recently had a very nice upside technical breakout that I wanted to discuss today. While the stock has already moved quite a bit higher since the breakout approximately a month ago, there should be some further upside potential, and I also wanted to use this as an example for when you may see such a breakout in the future.
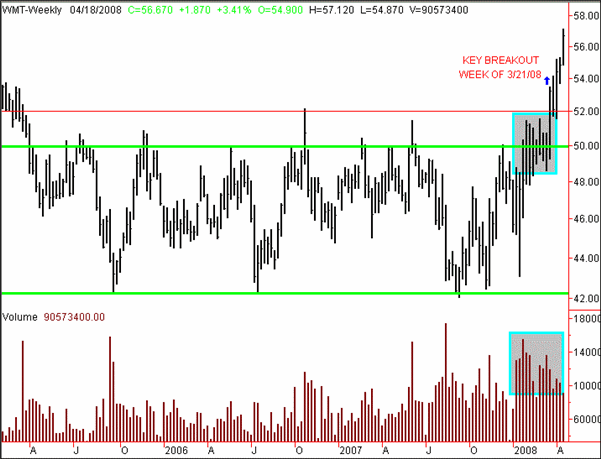
If you examine the chart below, you can see that WMT had basically been in a sideways trading range since early-2005, about 3 years. It had been locked between 42 and 50 (green horizontal lines), with upside also capped above around the 52 level (red horizontal line).
WMT WEEKLY CHART

In Early-February 2008, WMT began to break above the 50ish level top of its trading range. This led to about a 2-month consolidation around this important support/resistance level, as seen by the Top Grey Rectangle. This consolidation was also accompanied by high Weekly Volume in the stock, seen in the Bottom Grey Rectangle. This higher-than-normal volume is a good confirmation to me of a bullish breakout.
However, the real breakout did not occur until the stock moved above the 52 level during the week of March 21. The 52 level was what I would call secondary resistance at this point. Since the break above that level, WMT has continued to move strongly higher to around 57.
Now, I personally am not an expert on Wal-Mart's fundamentals. I like that my local Wal-Mart store is open 24 hours, but if given a choice, I would prefer to shop at Target over WMT. But as the old saying goes, "The Tape Tells The Tale", meaning the chart is telling us that something positive is going on, whether in fundamentals, accumulation and/or sentiment.
In my experience, when a security breaks out of a tight 3-year range like this, it can be expected to have a subsequent 6-month to 1-year rally. WMT has already moved higher, but can easily move to 60, in my opinion, and perhaps 65, based on this breakout, over the medium-term. As with any stock, I wouldn't chase a streaking rocketship higher, but rather look to accumulate on pullbacks. Perhaps 53ish would be a nice level to purchase some, if we see a retracement of gains, or around 55.
Price Headley is the founder and chief analyst of BigTrends.com.
|