| Weekly Outlook in the Stock Market |
| By Price Headley |
Published
04/20/2008
|
Stocks
|
Unrated
|
|
|
|
Weekly Outlook in the Stock Market
NASDAQ Composite
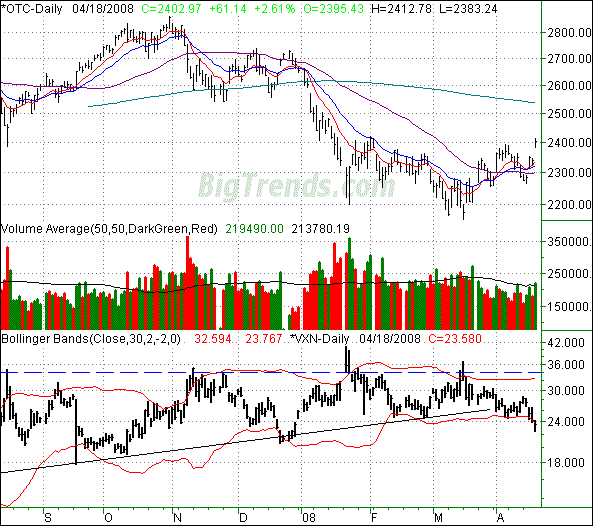
Friday's huge 2.61% rally for the NASDAQ (61.14 points) left it at a close of 2402.97. For the week, the composite gained 112.73 points, or 4.92%, the best performance of all the major indices. And, it closed at multi-week highs. Maybe this is the breakout move we've been waiting for, or maybe not.
There certainly hasn't been a lack of volatility lately...much more so than usual. Most of it has been overnight, meaning the index would jump from one day to the next. The end result was gaps. Most have been filled, but the last two have not, which is the bearish concern at this time.
So, here's the bet the bulls are making -- those two gaps from last week won't be filled. Based on the strength alone it might not be a bad bet. Those gaps, however, have too often been a vacuum, reeling a trend in.
But the VXN (and the VIX) broke their support lines. Isn't that bullish? Yeah, technically, but last week was also expiration week. Strange things can and do happen. We're looking for the gapes to be filled.
NASDAQ Composite Chart - Daily

S&P 500
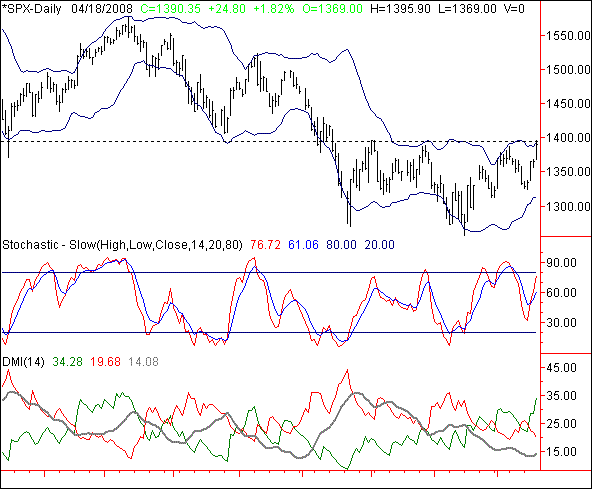
The S&P 500 gained 24.8 points (+1.82%) on Friday. On a weekly basis, the large cap index was up 4.31%, or 57.5 points. The move aloes left the SPX teetering on the verge of new highs -- a break past a ceiling that had been a problem for the last three months. We're not out of the woods yet though.
As we mentioned with the NASDAQ, overnight volatility has been a la mode for the last several weeks. That's why we're not jumping gung-ho onto last week's strength. One of the biggest reasons for that is the Bollinger Bands. The SPX bumped into the upper one with Friday's rally.
If you look closely, you'll see the upper band has been a ceiling in all the most recent instances it was touched. Throw in the fact that we're stochastically oversold.
So, here's our line in the sand: 1396. That was the February high, and has pretty much been the ceiling for the last couple of months, including Friday. If that line breaks, we can risk being bullish. If it doesn't break, we'll look for the index to sink back to at least 1313.
S&P 500 Chart - Daily

Dow Jones Industrials Average
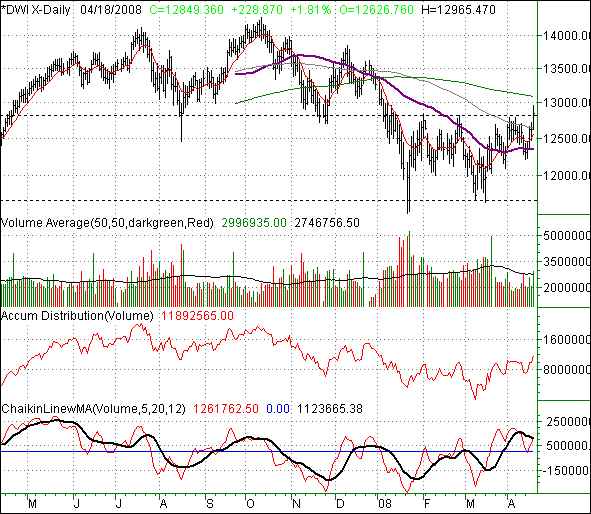
After gaining 228.87 points on Friday (+1.81%), the Dow ended the day at 12849.36. For the week, the blue chip index closed 523.94 points higher (+4.25%) than the previous week's close. Most all the signs (much like the other two indices) point to bullishness ahead here. We're equally cautious though.
The close at 12849.36 was the best close since early January, as well as a move above a key ceiling line around 12,800.Mreover, the volume trend has turned bullish a swell - even if a little erratic.
The problem is follow-through. We've seen very little of it this year, so we have to have doubts about any follow-through this time around. The one different factor we have now that we didn't have before -- and this is working against the bulls -- is the potential resistance at the 200 day line. It's currently at 13,092, and should really be the litmus test.
If the Dow can get and stay above that mark, we'll flip to a bullish stance. On the other end of the equation, wed need to see a dip back under the 560 day line (purple) at 12,366 top jump-start the bearishness again.
Dow Jones Industrials Average Chart - Daily

Price Headley is the founder and chief analyst of BigTrends.com.
|