| Corcoran Technical Trading Patterns for April 21 |
| By Clive Corcoran |
Published
04/20/2008
|
Stocks
|
Unrated
|
|
|
|
Corcoran Technical Trading Patterns for April 21
Friday's trading proceeded very much in line with the hypothesis that large write-downs by the banks (i.e. Citigroup in this instance) are now seen as cues for opportunistic traders to exit their short trades in the financial sector. The rally before the open on Friday had all of the characteristics of short covering, especially within the European session prior to the New York open.
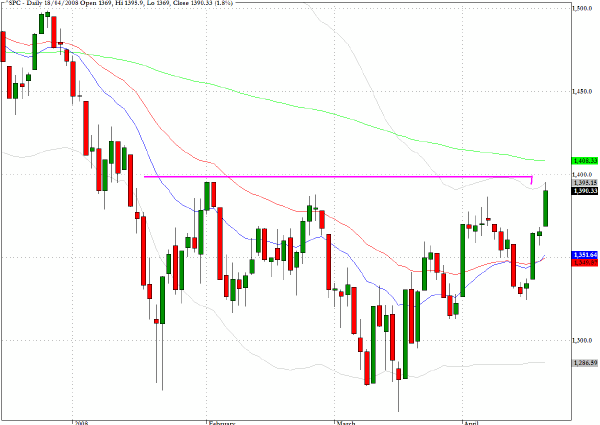
The S&P 500 cash index (^SPC) moved up 1.8% and is now approaching the 1400 level and the 200-day EMA. One divergence that caught my attention was the discrepancy between the behavior of the cash index and the exchanged traded instrument, SPY. The ETF opened almost on its high for the session but concluded below its enthusiastic start, rendering a red candlestick, and the volume was only marginally above average. We saw the break above the 200-day EMA on the S&P 400 Midcap index that I expected, but several other indices have to now validate this ostensibly positive development.
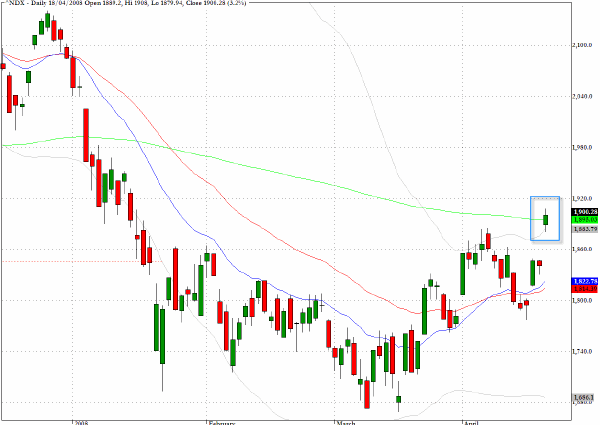
The Nasdaq 100 (^NDX) gapped up on the open and left an island formation that straddles the 200-day EMA.
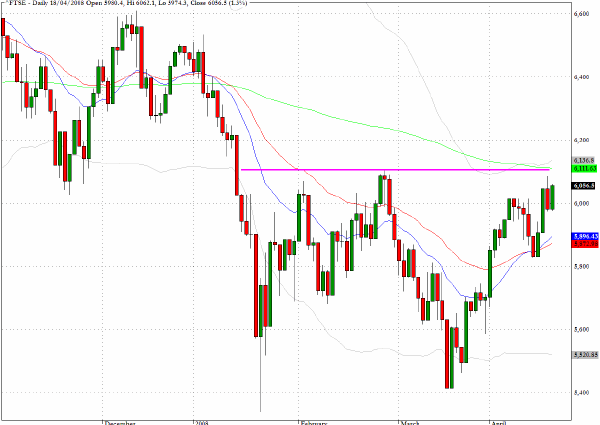
Along with many global indices the UK's FTSE 100 (^FTSE) now confronts clear chart hurdles and the 200-day EMA. In Friday's session Germany';s DAX index produced one of the better performances of the day as it moved ahead by 2.4% and broke above the critical 6800 level. A useful metric for assessing the recent relative under-performance of the German index is the fact that it still has another 300 points to cover before it encounters its 200-day EMA.
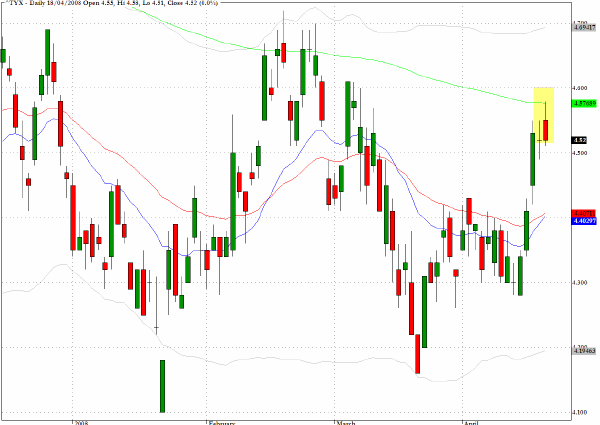
The liquidation of long Treasury holdings and the waning of the safe haven mindset continued in early trading on Friday but, as expected, buying interest emerged as the thirty year bond approached the 4.6% yield. I suspect we will have more probing of the upside potential for yields in coming sessions, but it will require an even more profound change of sentiment in the market to see yields break above 4.75%
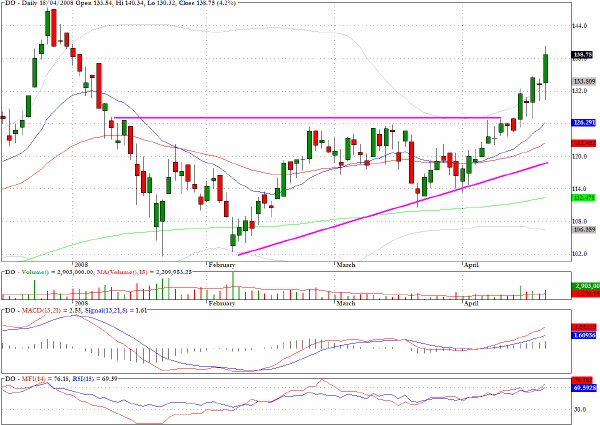
Last week Diamond Offshore Drilling (DO) was cited as a good example of one of my favorite patterns - the upward wedge pattern - and the remainder of the week produced generous returns.
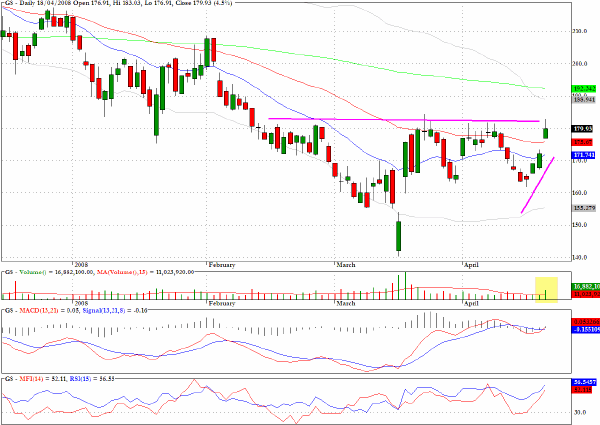
The chart for Goldman Sachs (GS) appears ready to break out of an ascending wedge pattern.
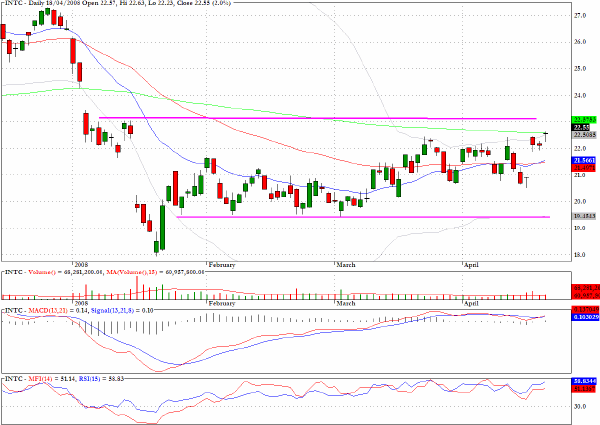
Intel (INTC) remains in a constricted range and, despite last week's upbeat earnings report, the extended channel has remained intact. If the bulls are to take control of proceedings, one would expect to see a little more dynamism from stocks such as Intel.
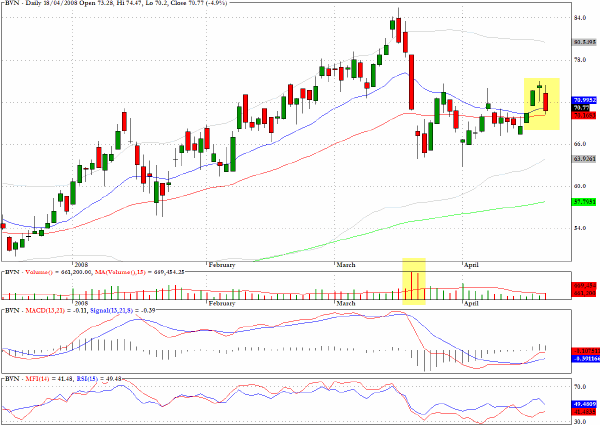
BVN performed well for us on the short side in early April and the three candlestick formation from last Friday - an evening star- could be pointing to further weakness.
Clive Corcoran is the publisher of TradeWithForm.com, which provides daily analysis and commentary on the US stock market. He specializes in market neutral investing and and is currently working on a book about the benefits of trading with long/short strategies, which is scheduled for publication later this year.
Disclaimer
The purpose of this article is to offer you the chance to review the trading methodology, risk reduction strategies and portfolio construction techniques described at tradewithform.com. There is no guarantee that the trading strategies advocated will be profitable. Moreover, there is a risk that following these strategies will lead to loss of capital. Past results are no guarantee of future results. Trading stocks and CFD's can yield large rewards, but also has large potential risks. Trading with leverage can be especially risky. You should be fully aware of the risks of trading in the capital markets. You are strongly advised not to trade with capital.
|