NASDAQ COMMENTARY
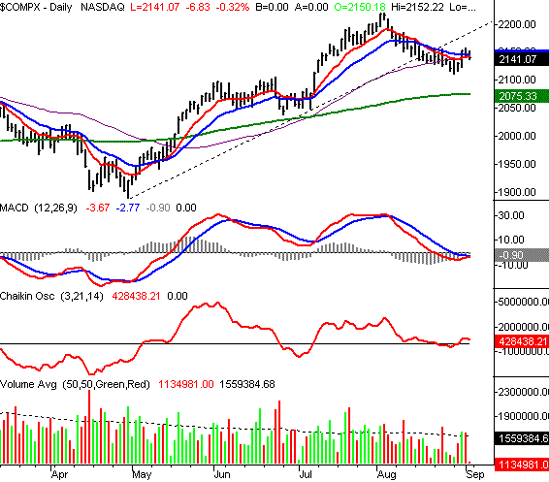
The NASDAQ gained 20.3 points last week, to close at 2141.07. That's about a 1 percent gain, but the composite had actually been as high as 2157.32 on Thursday. So while the week turned bearish after a very bullish beginning, the index still closed higher. In other words, we're facing some major mixed signals here.
The primary trend indicators - the 10 and 20 day averages - have seen both sides of the coin in the last few days. The NASDAQ surged above them on Wednesday, but crossed back under both of them by Friday. Technically, this is the first part of a short-term sell signal. The second part, to complete the signal, would be a lower close. However, at this point, we're not counting on seeing that. Why? For the same reason that Wednesday's buy signal didn't mean anything - there wasn't any confirmation. It's just a choppy time for the chart right now, so it may be prudent to let investors figure out which way they want to push stocks.
As for other technical indicators, there's not much more help. After Wednesday, we were on the verge of getting a bullish MACD crossover. But now, we're seeing a bearish divergence again. The Chaikin line actually did make a buy signal on Wednesday, but that line too is already pointing lower again. And had Friday been a higher volume day, that bearish slope would be even more pronounced.
So then, we're neutral-to-bearish here, but acknowledge that the week was still pretty impressive. The other thing we'll point out is that the bulls and bears have been trading blows this year....in month long segments. May and July were solid months, while June and August were weak. If that pattern is maintained, that means September should actually be a positive time.....but we wouldn't buy into that alternating pattern until we could at least get back above the 20 day average, at 2415.
NASDAQ CHART - DAILY

S&P 500 COMMENTARY
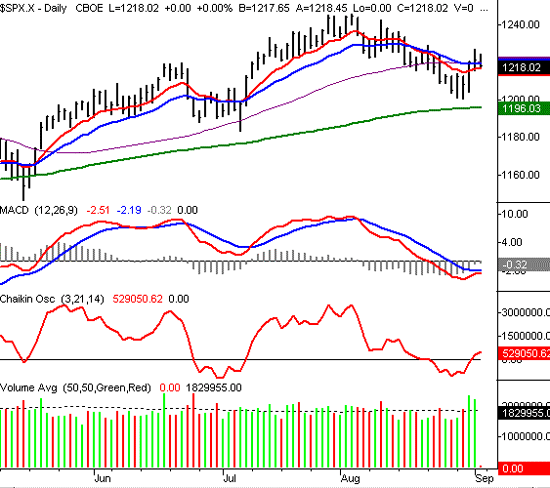
The S&P 500 gained 1.0 percent last week as well, moving from 1205.10 to 1218.02. That 12.9 point rally, however,(like the NASDAQ's), had actually been much higher. We saw the index reach 1227.29 on Thursday, only to have things turn south as the week came to a close.
And like the NASDAQ, the result of last week is a host of mixed signals. To compare apples to apples, we'll apply the same tools. The MACD lines, which had been on the verge of a bullish crossover, now don't look as promising. This Chaikin line had crossed above zero too, and while we don't have Friday's volume data yet, we suspect that if we did, this indicator would also be rolling over.
Yet, there is one key difference between the NASDAQ and the S&P 500. The S&P 500 is still above the 10 day line.....barely. The 10 day average is currently at 1216.95, and essentially traces the lows from both Thursday and Friday. So, there's at least some sort of support interest there. However, the 20 and 50 day lines didn't hold up as support - they're both at 1220.
So like the NASDAQ, at this point, it's coin toss....and those aren't odds 'with an edge'. We suspect that we'll get much more meaningful (and telling) movement on Tuesday, when normal trading resumes. For the most part, the three day weekend actually started at the middle of Thursday, when trading slowed to a snails pace. Activity should pick up again, now that summer is officially over and we're gearing up for the busiest time of the year. From here, we'll be watching volume as much as anything else. And maybe we're already getting a subtle hint of things to come....take a look at Wednesday's and Thursday's volume bars. They're both bullish, and it's the highest volume we've seen in two months.
S&P 500 CHART

DOW JONES INDUSTRIAL AVERAGE COMMENTARY
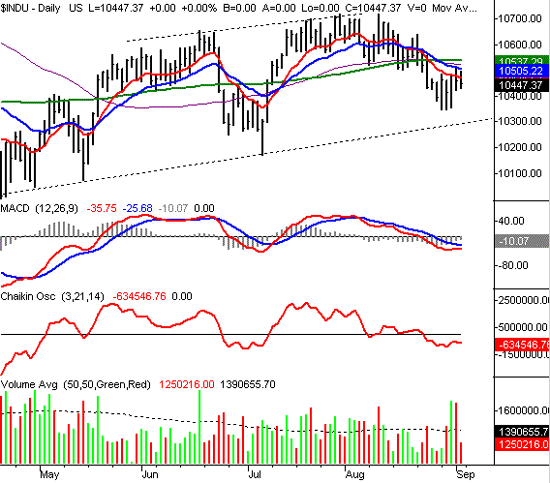
Once again, the Dow struggled to keep up with the rest of the market. The industrial average only gained 50.8 points, or 0.5 percent, to close out the week at 10,447.37. And as usual, the Dow's chart is the most bearish of them all.
The Dow finished under all the key averages, including the 200 day line. Didn't the NASDAQ also basically do the same? Yeah, but there's a difference - the Dow never even managed to get above the 20 day line. In fact, the 20 day line was resistance on Thursday, when the Dow peaked at 10,513.76.
So it makes sense to say that the technical indicators here never really became un-bearish. The bearish MACD divergence from early August stayed bearish last week, although the lines flattened a bit. And the Chaikin line is still under zero....and never even threatened to cross into positive territory. The point is, the Dow - whether the market goes higher or lower - still appears to be the weakest of the three sisters.
Resistance is peppered between 10,472 and 10,537. Support is now at 10,300.
DOW JONES INDUSTRIAL AVERAGE CHART

BOTTOM LINE
Just a quick note on the dynamic between the NASDAQ and the Dow......The former has been solid, while the latter has been anything but. The implication is that the market has stayed in 'speculation' mode, and steered away from the proven blue-chips. Generally speaking, that's a positive environment for stocks. In the meantime, a little patience should be exercised until we can get back on the top side of the moving averages.
Price Headley is the founder and chief analyst of BigTrends.com.