| A Mid-Week Look at the Market |
| By Price Headley |
Published
04/23/2008
|
Stocks
|
Unrated
|
|
|
|
A Mid-Week Look at the Market
Now that we are ensconced in springtime, with flowers in bloom, birds chirping, and other clichés, we begin to hear common refrains about summer doldrums in the market, slowdowns in technology, weak volume, traders on vacation, and whatnot.
Instead of just relying on the conventional wisdom, I decided to examine the hard numbers on the NASDAQ Summer/Autumn performance over the past five years to see if any trends can be gleaned. QQQQ, the ETF designed to mimic the NASDAQ 100),was used as a NASDAQ proxy, with weekly open/close/low data.
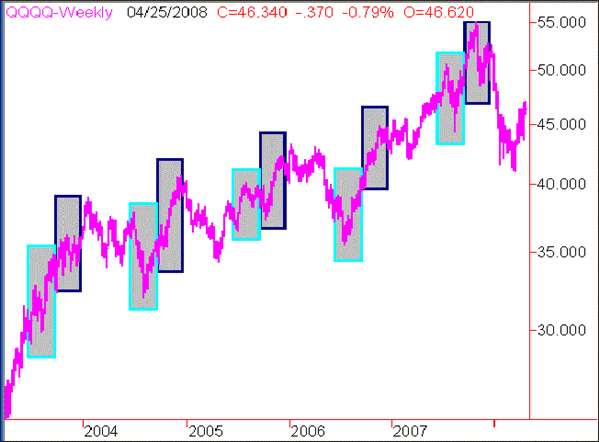
First, to refresh your memory, summer is actually defined in North America as June 21 to September 20. Autumn is defined as September 21 to December 20. Here is the visual representation of the Summer/Fall Weekly performance of the QQQQs from 2003-2007. The grey rectangles enclose the two seasons.
QQQQ Weekly Chart with Seasonal Graphics

From the "eyeball test", you can see that in several of the recent summers, the QQQQ had a "V" shaped formation, indicating a selloff and subsequent rally back to near or beyond the original level. You can also see that several of the recent Autumns had nice consistent diagonal uptrends.
Now to the specific numbers:
QQQQ Summer Open to Close Performance Average (2003-2007): +3.64%
QQQQ Autumn Open to Close Performance Average (2003-2007): +8.08%
QQQQ Summer Open to Intra-Week Low Performance Average: -6.07%
QQQQ Autumn Open to Intra-Week Low Performance Average: -2.23%
What this data indicates is that the Fall/Autumn QQQQ Performance is over twice that of the summer numbers. In addition, the low/drawdown in summer is over two-and-a-half times as deep as in the autumn.
Now, I am not specifically predicting a large gain for the NASDAQ in either the summer or auturm, considering how the longer-term uptrends appear to have broken down somewhat. But, the bottom line is that I would still expect relative outperformance in the autumn vs. the summer, and any summer sell-off/correction to be deeper than one in the autumn.
Price Headley is the founder and chief analyst of BigTrends.com.
|