Professional trader Price Headley provides a look at the stock market for the week of April 28.
NASDAQ Composite
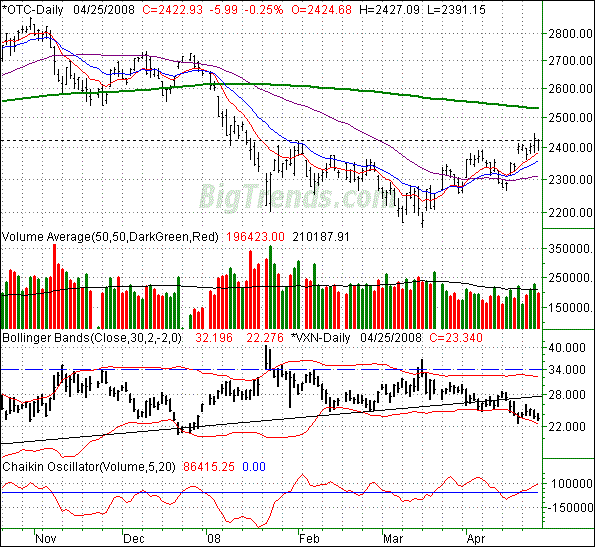
For a few weeks now, we've been evenly staring at both bullish and bearish possibilities. It may come as no surprise then that we don't necessarily have any more answers today. We do, however, still have plenty to look for in our search for the elusive sign of what's to come. By the way, we've switched to candlestick charts today to fully illustrate the kinds of pressure we're seeing.
The NASDAQ was the only index to lose ground Friday, falling 0.25% (-5.99) points to end the day at 2422.93. For the week, it still managed to close up by 19.96 points, or 0.83%. It was a tepid gain, but cemented the odds of more upside ahead.
Though it didn't hang onto it on Friday, the OTC held up fairly well on Friday after reaching new multi-week highs on Thursday. We're also seeing support from all the short-term average lines.
We'll go ahead and let you know now that the Dow and the NASDAQ are a bit at odds with each other in this front, but the NASDAQ has seen its bullish volume grow over the last few days -- an important bullish clue.
However, from here we can afford to wait to see what happens at the 200-day line. It's at 2531. Everything else the bulls need is in place though volume and momentum.
NASDAQ Composite Chart - Daily 
S&P 500
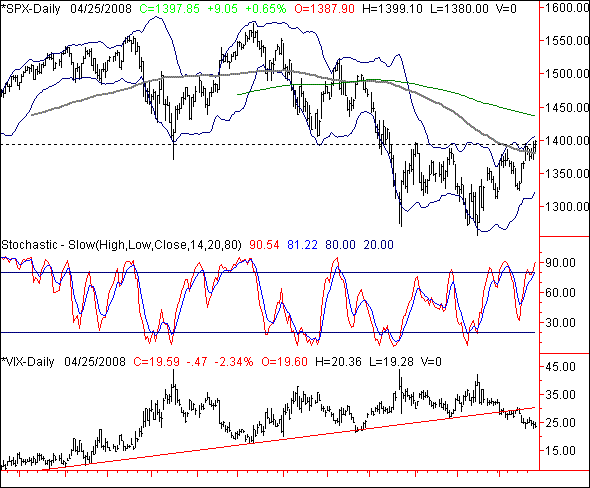
The S&P 500's 9.05 point gain on Friday (+0.65%) was the best of all the indices. On a weekly basis, the large cap index gained 7.5 points, or 0.54%, the end at 1397.85. That's the best close in about three months. Though the index has started to knock down some walls, ironically, it's also the index that appears to be tapering off the most.
Here's the bullish case. The SPX is back above the 100-day average line (grey), and of course, the 10- and 20-day lines (not shown). At the same time, the VIX has finally broken that long-term support line of its own.
Here's the bearish case. There's still a nagging ceiling right under 1400. So, there's your outlook -- the 1400 level is the key.
That being said, we don't trust the bulls here to really follow-through. If 1400 breaks, watch what happens when the S&P 500 reaches the 200-day line (green) at 1437. A move up to there from the low of 1257 could really sucker a lot of people in, only to pull the rug out from underneath them. If we get past 1437, things could really get cooking.
S&P 500 Chart - Daily 
Dow Jones Industrials
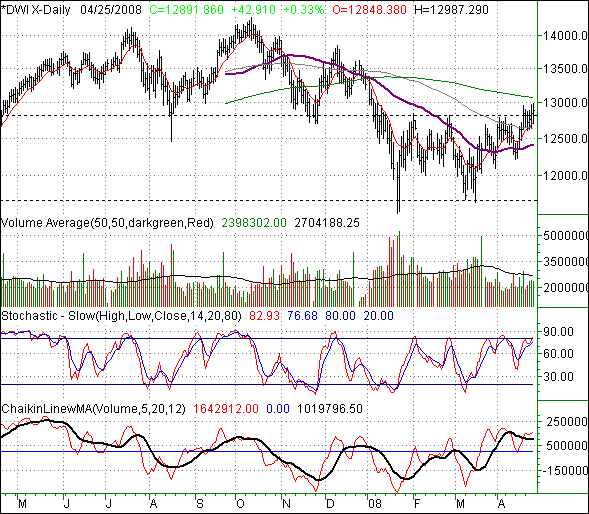
The Dow Industrials advanced 0.33% on Friday (+43 points), closing out at 12,892. That was also the weekly numbers, meaning the blue chips had been flat through Thursday. More importantly, the Dow has started to find support at its key moving averages, except one.
Like the S&P 500, the Dow is finding support at its moving averages too. Unlike the SPX, the Dow has actually moved above its February highs -- a bullish sign. The problem is, the rally is more hollow than it appears to be on the surface.
First off, note that we're back into a stochastically overbought scenario. It's not the end of the world. We've seen it several times in the last few months. Each instance was met with a dip, but only a short-lived dip.
No, the real problem here is volume, or lack of it. The index has been heading higher, but volume hasn't been growing. It's been shrinking.
Part of that may be no real faith in stocks, or part of it may be the season. Things slow down when the weather gets good. It doesn't matter though, both are a threat to the uptrend. The odd part is how the NASDAQ isn't having the same problem. It could be rotation of a sort, but rotation would mean one is gaining at the other expenses, which isn't what we're seeing.
As with the S&P 500, a close above the 200-day line (blue) at 13,077 would go far in reassuring the bullish potential. Until then, we're hesitant to jump on the bandwagon. Good news though. It's close.
Dow Jones Industrials Chart - Daily 
Price Headley is the founder and chief analyst of BigTrends.com.