| Corcoran Technical Trading Patterns for April 28 |
| By Clive Corcoran |
Published
04/28/2008
|
Stocks
|
Unrated
|
|
|
|
Corcoran Technical Trading Patterns for April 28
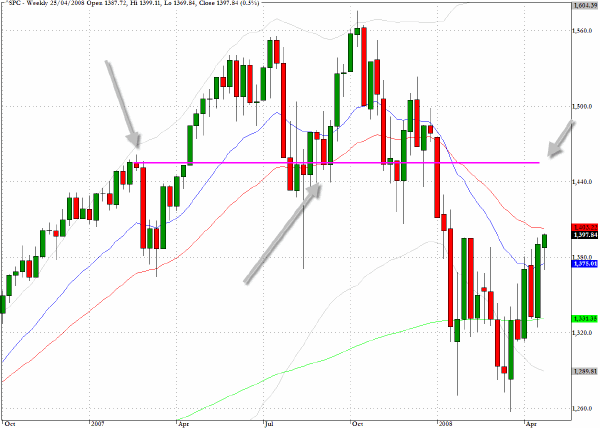
In the coming week traders will have two key events to digest which could undermine some of the “wisdom” that is incorporated in the market's current future discounting assumptions. One is the release on Wednesday of the FOMC minutes, and if there is a signal that rate easing may be done or close to done, then traders will have to decide whether they have calibrated this eventuality correctly. On Friday the employment report will be released, and, in this regard, the widely held assumption that the downturn is going to be relatively shallow, will be severely challenged if the numbers are awful. Providing that the consensus view does not get a double whammy on these two issues, I would be targeting 1455-1460 during May for the S&P 500. This would bring us back to the level from late February 2007 which marked the beginning of the market’s acknowledgement of the looming crisis with mortgage-backed securities.
The S&P 500 (^SPC) concluded last week at 1397 and the index now confronts two significant technical hurdles. On the weekly chart the 50-week EMA lies at 1403 and on the daily chart the 200-day EMA is to be found at 1407. To feel more comfortable about the authenticity of the recovery I would ideally want to see us close out this coming week with a close above 1410 on the S&P 500.
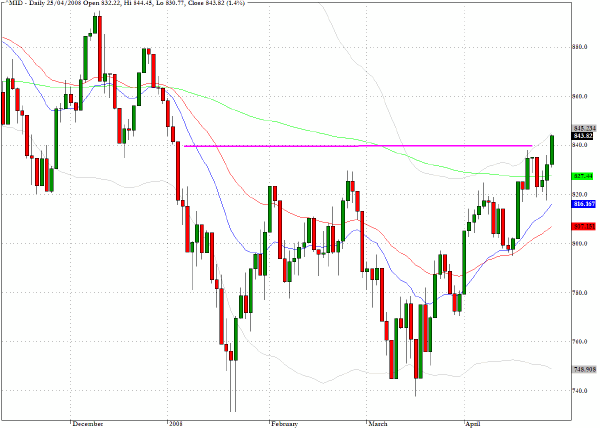
Encouraging my suspicion that the S&P 500 index is about to break through the 1410 barrier is the recent positively diverging behavior of the S&P 400 Midcap Index (^MID). As noted in my recent commentaries the index has been in the vanguard of the current rally and the midcap stocks have already surpassed both the weekly and daily EMA target levels discussed above, during last week’s trading.
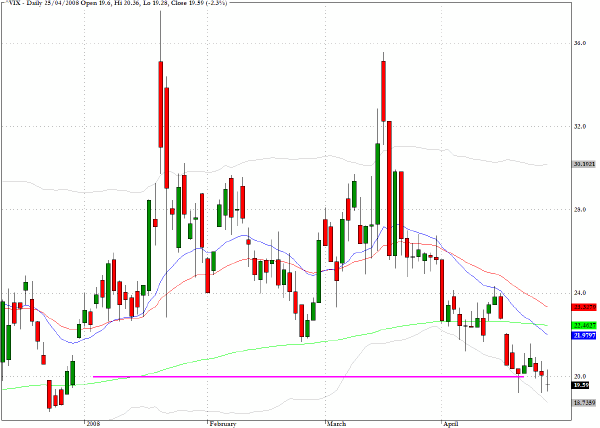
Although I am generally upbeat about the prospects for equities, there is one characteristic of the current market environment that is causing some concern. As is evident from many market dynamics there is a growing complacency. The CBOE Volatility Index (^VIX) continues to register new low readings for the year, and even plunging consumer confidence levels to multi-year lows are treated with a casual indifference. This over-confidence that the worst is already behind us, is pushing us toward a situation where we are now seeing a diametrical reversal in sentiment.
Before the cathartic events of mid-March there was too much pessimism and despair about a financial meltdown, and now there appears to be an over-reaction whereby all bad news is treated positively by many traders. What this is pointing to, I suggest, is the fact that the market is not really being stress tested on the sell side at the moment. The drift upwards however has the potential to be suddenly disrupted if the consensus view becomes persuaded that its discounting foresight has miscalculated the severity of the global slowdown.
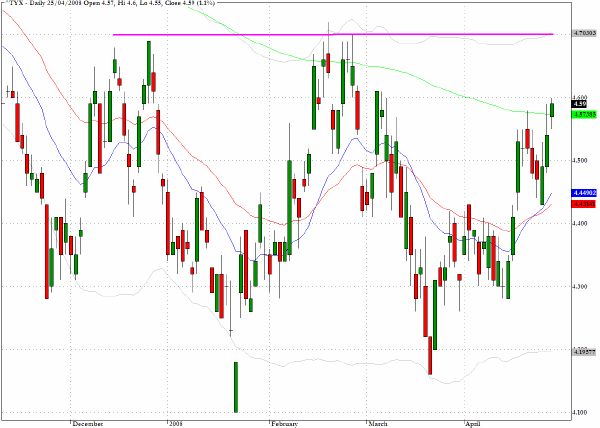
The theme that I am seeing within the markets generally, is that across several asset classes, there is a re-alignment taking place where the safe haven bets of a few weeks ago - Treasuries, consumer staples and even some commodity plays - are being unwound as fund managers become more adventurous with equities again.
The yield on the 30-year Treasury Bond looks set to test the 4.75% level which marks the upper boundary for 2008 so far, and how well Treasuries perform, during this testing of the upper range limits, will also help in understanding how much further the global equities recovery has to go. Yet another factor that could play into the sector rotation strategies is the fact that the recent $1.60 level achieved by the euro could well turn out to have been the fulfillment of a long term strategic target and one that may have left many currency traders too tilted on the short side of the US dollar.
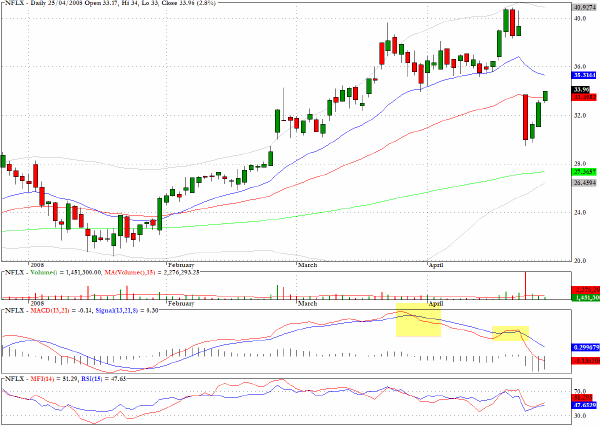
Netflix (NFLX) succumbed to the negative divergences on the MACD and MFI charts last week and could pull back towards $36 before further selling is to be expected.
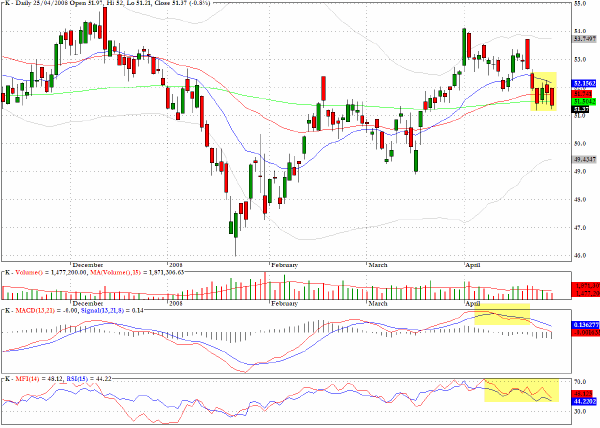
Some defensive plays are beginning to show declines. Kellogg (K) has clear evidence of negative divergences in momentum and there are also signs of distribution following a lower double top pattern.
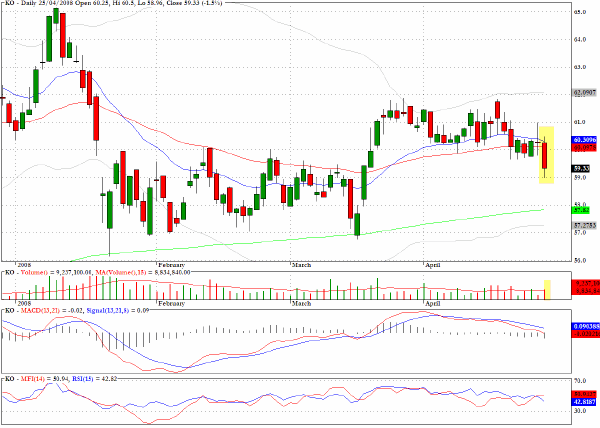
Coca Cola (KO) dropped below two key moving averages in Friday’s trading.
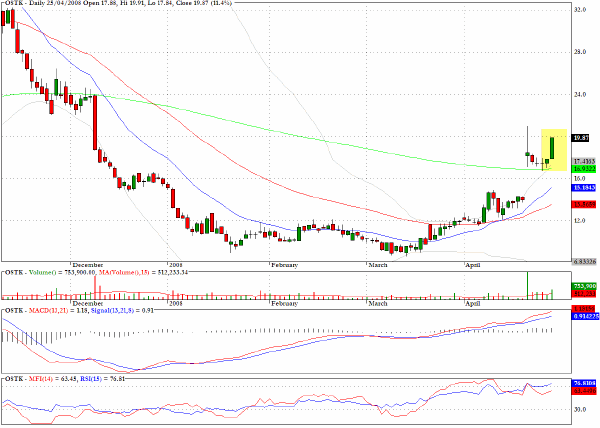
On Friday I noted that Overstock.com (OSTK) appeared to have consolidated its recent upsurge and that a further leg up seemed likely. The stock provided an excellent entry opportunity on Friday morning - opening at the same price as the previous close - and would have returned more than eleven percent for the session.
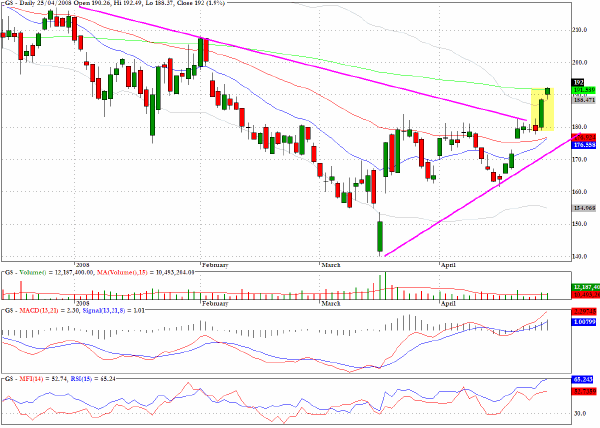
The broker/dealer sector (^XBD) registered an impressive performance last week. The investment banking index gained 6.5% for the week and also sustained two closes above the descending trend-line through the highs seen in 2008. Reviewing the bigger picture targets for this index I would be looking for continued progress from here up towards the 200 level. At this level on the XBD there could be considerable resistance from both the 50-week EMA and the 200-day EMA. Goldman Sachs (GS) would be my preferred play within the sector and I would suggest an intermediate term price target of $215. At the 200 level on this index, which might well co-occur with the attainment of the 1455 level on the S&P 500, I would expect to see a more determined effort by the short side to test the conviction behind the rally phase.
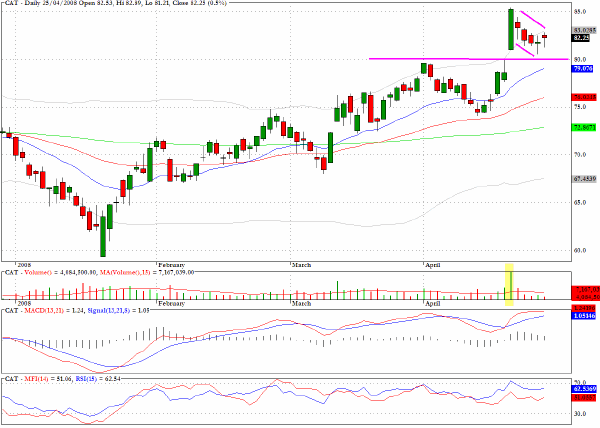
Caterpillar (CAT) could reach back towards $80 but should then find renewed buying interest
Clive Corcoran is the publisher of TradeWithForm.com, which provides daily analysis and commentary on the US stock market. He specializes in market neutral investing and and is currently working on a book about the benefits of trading with long/short strategies, which is scheduled for publication later this year.
Disclaimer
The purpose of this article is to offer you the chance to review the trading methodology, risk reduction strategies and portfolio construction techniques described at tradewithform.com. There is no guarantee that the trading strategies advocated will be profitable. Moreover, there is a risk that following these strategies will lead to loss of capital. Past results are no guarantee of future results. Trading stocks and CFD's can yield large rewards, but also has large potential risks. Trading with leverage can be especially risky. You should be fully aware of the risks of trading in the capital markets. You are strongly advised not to trade with capital.
|