| Major Indices Nearing 50 Percent Retracement Levels |
| By Price Headley |
Published
04/28/2008
|
Stocks
|
Unrated
|
|
|
|
Major Indices Nearing 50 Percent Retracement Levels
The major indices have been rallying since bottoms in January and/or March 2008. However, if you go back to the October 2007 market highs, the S&P 500 Index (represented by SPY), NASDAQ 100 (represented by QQQQ), and Dow Jones Industrial Average (represented by DIA) are all reaching important retracement resistance levels, in my view.
A 50% retracement means that the security has taken back, or "retraced" 50% of the losses/gains it had. I calculated these 50% levels based on both daily closing high to daily closing low, and intra-day high to intra-day low, and took an approximate average number between the two.
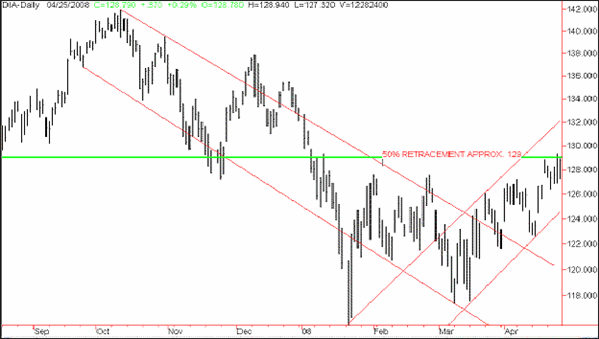
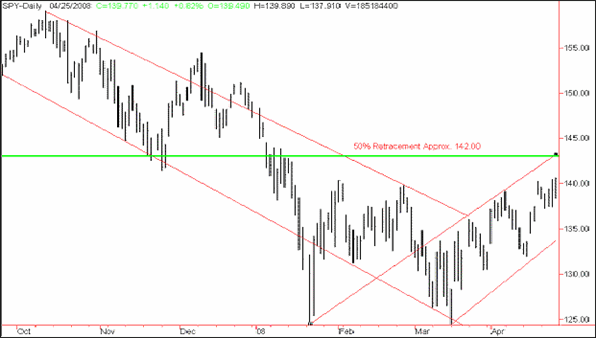
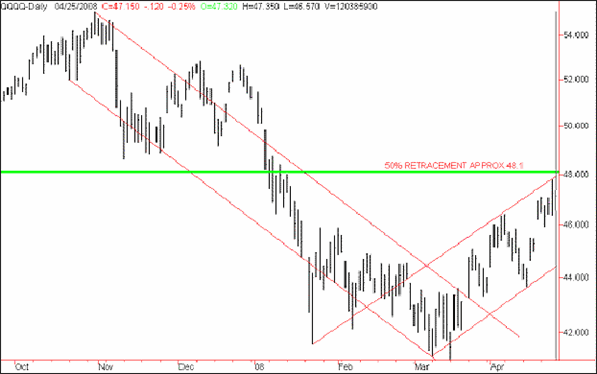
So, based on October highs to either January or March lows, these levels are as following on the three indices, represented by the green horizontal line:
DIA: around 129, equivalent to 12,900 on DJIA
DIA Daily Chart

SPY: around 142, equivalent to 1420 on S&P 500
SPY Daily Chart

QQQQ: around 48.1
QQQQ Daily Chart

Based on my past experience, a 50% retracement is often a strong support/resistance area and a key area for a reversal back to the underlying trend. Other technical analysts use Fibonacci sequences and other numerical calculations for figuring out key retracement reversal levels.
There is also often a time factor involved in retracements. For example, the October downtrend lasted roughly 5-6 months. I would expect that a classic 50% retracement rally would last around half that, or 2-3 months, before the underlying downtrend would resume. We are now around two months into the rally.
So the bottom line to this analysis is that we could have a bit more upside and two weeks to a month more strength on the major indices before they face significant overhead resistance and are likely to turn back lower, in my view.
Price Headley is the founder and chief analyst of BigTrends.com.
|