| Corcoran Technical Trading Patterns for May 1 |
| By Clive Corcoran |
Published
05/1/2008
|
Stocks
|
Unrated
|
|
|
|
Corcoran Technical Trading Patterns for May 1
The FOMC delivered the expected 25 basis points and released a statement that left most pundits guessing as to what comes next. The semantic analysis that followed the accompanying statement would have done a philosopher's convention proud as each phrase was micro analyzed for suggestions that the Fed was signaling a pause in the current round of easing. As suggested yesterday the key point, from my perspective, is that, whatever impression the Fed was trying to create with the statement yesterday, the market knows that it can count on Chairman Ben when things turn ugly.
We have now crossed one of the week's two big hurdles in terms of announcements - and tomorrow's employment data still has the capacity to be more momentous than yesterday's FOMC decision.
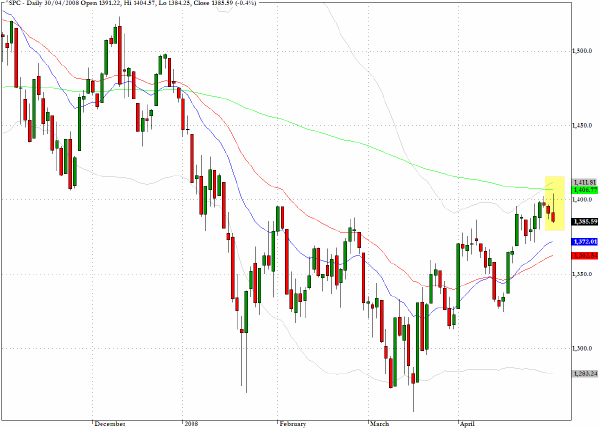
Equities gave up significant gains late in the session and in terms of the S&P 500 (^SPC) the pattern registered, a shooting star with the intraday high close to the 200-day EMA suggests that trading desks were happy to liquidate longs as key resistance levels were approached. As I remarked on Monday I would hope to see a close above 1410 in Friday's session to validate the view that the recovery has further to go.
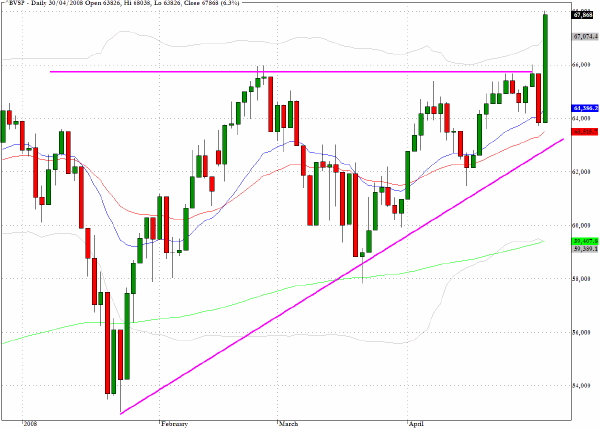
The Bovespa Index in Brazil (^BVSPA) closed decisively above the 66000 level in yesterday's trading with a rather convincing six percent move. We appear to have now broken out from the rising wedge pattern and further momentum should push this index further into all-time high territory. Needless to say it would be of considerable concern to the outlook for emerging markets if we were to see a major reversal and evidence of a false breakout at this stage.
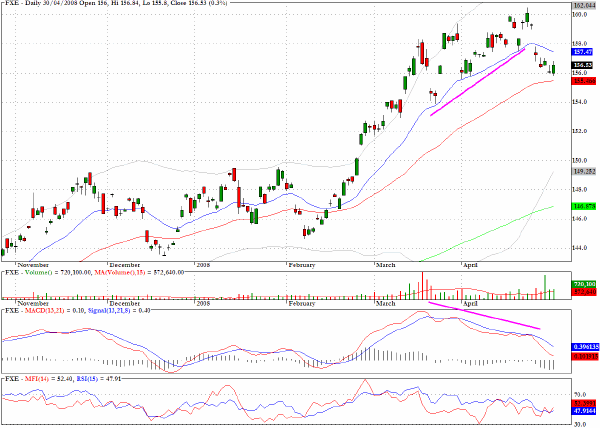
The exchange traded fund, FXE, tracks the euro currency against the dollar. What is clear from the chart is the negative momentum divergence during April that saw the euro reach above $1.60. The recent decline is being heralded by many pundits (perhaps too many!) as a major turning point for the dollar. Even if this is the case things rarely turn out to be neat and tidy and there could be some whipsaws ahead in the forex market.
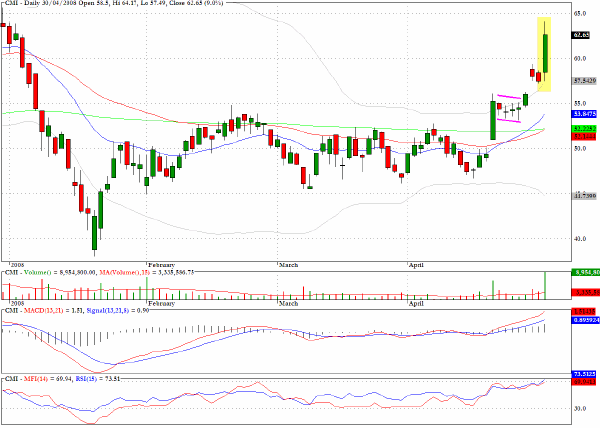
A week ago I discussed Cummins (CMI) and the developing bullish flag pattern. The stock rewarded generously yesterday with a nine percent gain.
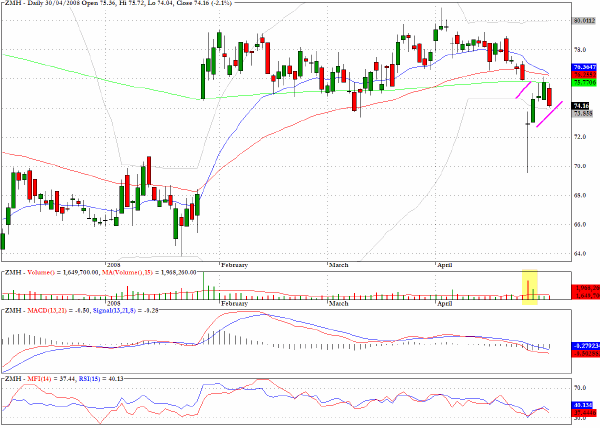
Zimmer Holdings (ZMH) has pulled back from a recent spike downwards and should have difficulty in moving back above the resistance from all three moving averages.
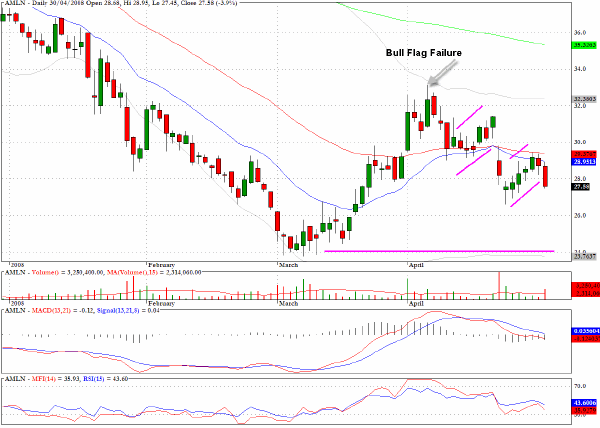
The chart pattern for Amylin Pharmaceuticals (AMLN) reveals a bull flag failure pattern. The candlestick pointed to shows how the top of the flagpole was penetrated and then reversed in the subsequent session. When these failure patterns arise they can prove to be reliably bearish and as can be seen the more recent formation shows a step down bearish flag formation. Although this is a complex pattern there is a presumption that the $24 level could be tested in coming sessions.
Clive Corcoran is the publisher of TradeWithForm.com, which provides daily analysis and commentary on the US stock market. He specializes in market neutral investing and and is currently working on a book about the benefits of trading with long/short strategies, which is scheduled for publication later this year.
Disclaimer
The purpose of this article is to offer you the chance to review the trading methodology, risk reduction strategies and portfolio construction techniques described at tradewithform.com. There is no guarantee that the trading strategies advocated will be profitable. Moreover, there is a risk that following these strategies will lead to loss of capital. Past results are no guarantee of future results. Trading stocks and CFD's can yield large rewards, but also has large potential risks. Trading with leverage can be especially risky. You should be fully aware of the risks of trading in the capital markets. You are strongly advised not to trade with capital.
|