| Corcoran Technical Trading Patterns for May 2 |
| By Clive Corcoran |
Published
05/2/2008
|
Stocks
|
Unrated
|
|
|
|
Corcoran Technical Trading Patterns for May 2
It was a remarkable day for the capital markets in the US yesterday - possibly having something to do with the fact that most of Europe was celebrating the May Day holiday. Several of the incipient trends that have been discussed here recently are starting to see follow through. Energy prices are ratcheting down, there is growing evidence that some hedge funds are exiting the industrial commodities, but perhaps most strikingly the bulls are really showing their enthusiasm for equities.
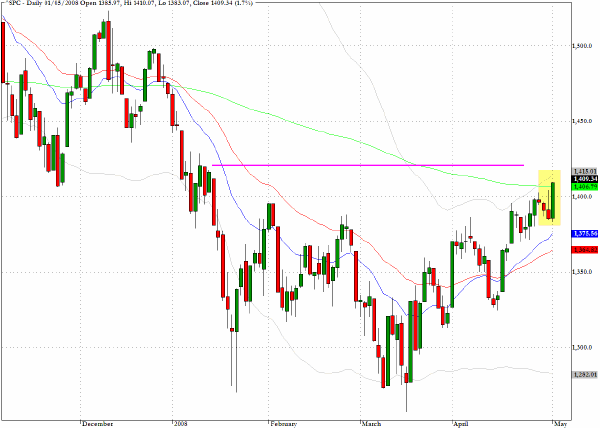
Yesterday I said that I would like to see the S&P 500 (^SPC) close out the week above 1410 - in other words after the market had digested today's employment data. This level is I think quite critical for underscoring the strength of the rally since late March, and would suggest that this is starting to look like more than just a normal bear market rally. Traders appear to be so impatient to test this level that they could not wait for today's data. 1410 was almost exactly the intraday high from yesterday but we have to see whether we can sustain the momentum today and manage a close either at or above that level today. If we can then the market will then be targeting at least 1460 in my estimation.
Several other indices and indicators are also approaching critical levels and one senses that the large macro players are accelerating the attainment of chart goals as the underlying dynamics manifest themselves. The process is similar to that seen in trend days when it becomes obvious where the market wants to head and most traders either get on board or at least get out of the way, leaving price movement to become more or less uni-directional.
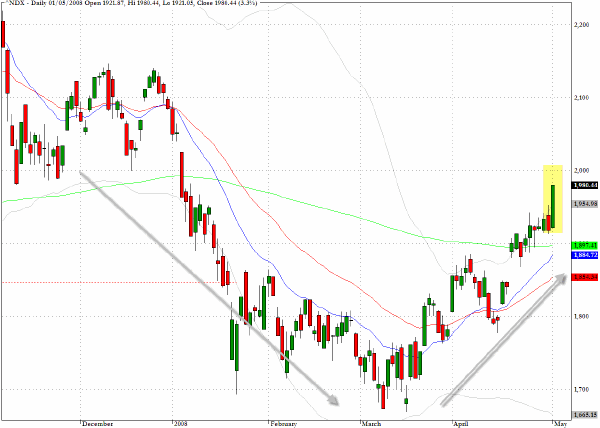
Another of the recent targets, that appeared, before yesterday's moves, to be a little further out on the horizon now looks to be soon attainable - perhaps even today - which is the 2100 level for the Nasdaq 100 (^NDX). The chart reveals quite clearly the U shaped recovery which may not be as steep as the V shapes we have seen in previous rallies but is, for that fact, perhaps more sustainable.
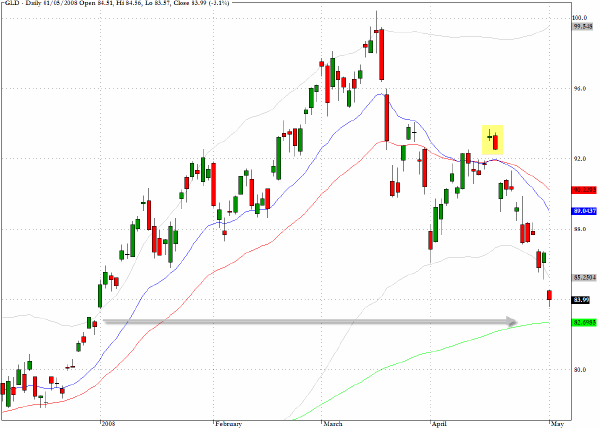
As discussed yesterday gold continued in its free fall. The June futures contract dropped $14.20, or 1.6%, to settle at $850.90 an ounce on the New York Mercantile Exchange. We are approaching a potential support region close to $830 as indicated on the chart for the exchange traded fund, GLD, that tracks the metal. Since discussing my bearish view of the metal two weeks ago on CNBC’s European Closing Bell the spot price has dropped by almost $100 per ounce.
One of the contrarian indicators that is worth following for indications of possible inflection points is the CBOE Volatility Index (^VIX) which yesterday dropped sharply and is now back to the levels of last December prior to the correction that got under way in mid December.

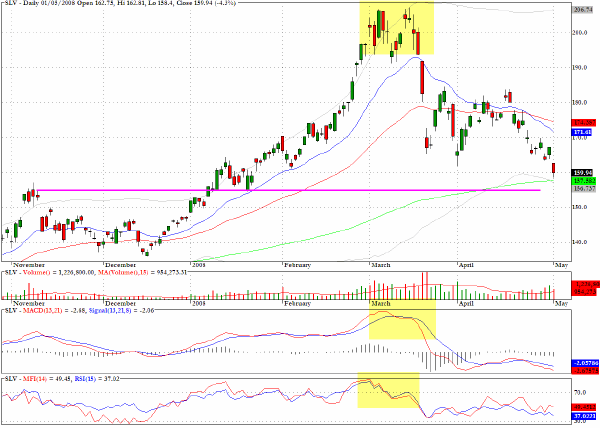
The chart for the exchange traded fund, SLV, which tracks the price of silver shows that the metal is approaching levels where some buying support should be expected. Also worth comment on this chart is the clear manner in which the two peaks in March were accompanied by negative divergences on both the MACD and the MFI charts.
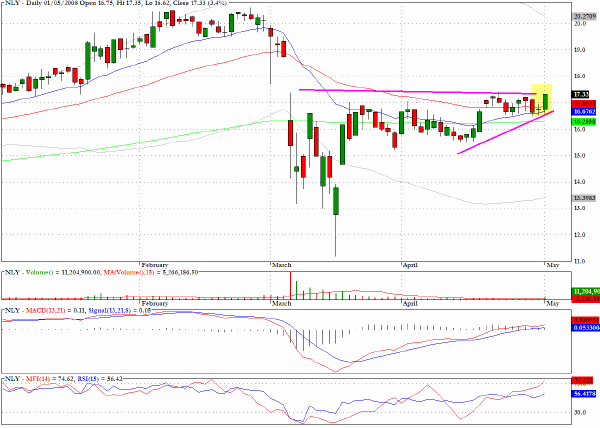
Annaly Capital Management (NLY) looks poised to climb further from the ascending wedge pattern.
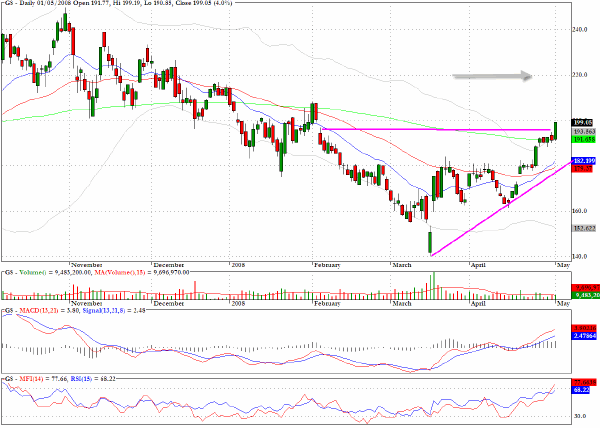
It was another strong session from the broker/dealer sector (^XBD) which added to its impressive performance from last week and moved up another 4.6% in yesterday's session. Reviewing the bigger picture targets for this index I would be looking for continued progress from here up towards the 200 level. At this level on the XBD there could be considerable resistance from both the 50-week EMA and the 200-day EMA. As mentioned on Monday Goldman Sachs (GS) is my preferred play within the sector and I now believe that an intermediate term price target of $225 could be achievable in coming weeks.
Clive Corcoran is the publisher of TradeWithForm.com, which provides daily analysis and commentary on the US stock market. He specializes in market neutral investing and and is currently working on a book about the benefits of trading with long/short strategies, which is scheduled for publication later this year.
Disclaimer
The purpose of this article is to offer you the chance to review the trading methodology, risk reduction strategies and portfolio construction techniques described at tradewithform.com. There is no guarantee that the trading strategies advocated will be profitable. Moreover, there is a risk that following these strategies will lead to loss of capital. Past results are no guarantee of future results. Trading stocks and CFD's can yield large rewards, but also has large potential risks. Trading with leverage can be especially risky. You should be fully aware of the risks of trading in the capital markets. You are strongly advised not to trade with capital.
|