| The McMillan Options Strategist Weekly |
| By Lawrence G. McMillan |
Published
05/2/2008
|
Options
|
Unrated
|
|
|
|
The McMillan Options Strategist Weekly
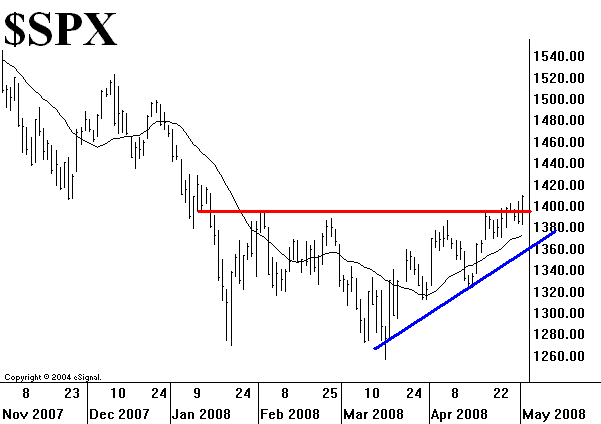
At long last, there has been a resolution to the standoff regarding the market bumping up against the 1400 area of $SPX -- and it has been resolved with a strong upside breakout. Whatever technical short-comings might have accompanied this breakout, it should be propelled for a while by short covering and momentum trading. That should be able to drive $SPX to the former 1440-1450 resistance area at least. The 1390-1400 area, which was a major resistance area at which bulls and bears "did battle" for nearly two weeks should now serve as support. Any failure below 1390 would negate this breakout.

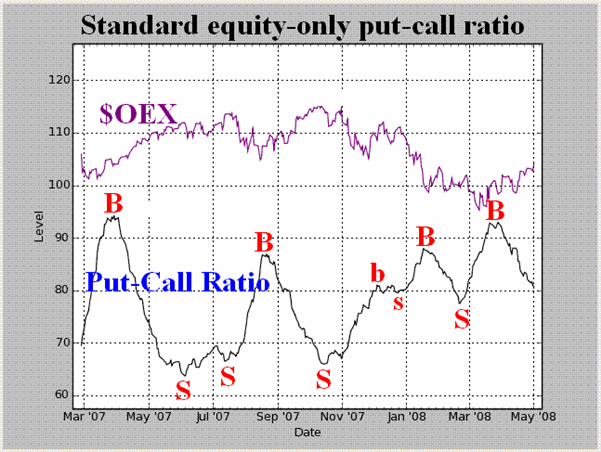
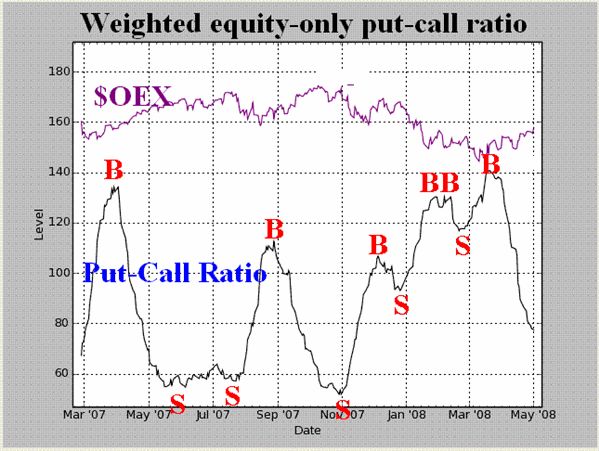
The equity-only put-call ratios have correctly remained bullish since late March. The standard ratio (Figure 2) is in the midst of its recent range of values, but the weighted ratio (Figure 3) has already descended most of the way towards recent historical lows -- suggesting that this rally is closer to the end than the beginning. This is one of those technical short-comings. Regardless, these ratios remain bullish as long as they are descending on their charts.

Market breadth (advances minus declines) has not been strong (another technical short-coming). In fact, sell signals were generated twice in the past couple of weeks because breadth was not expanding. Nevertheless, the market has broken out on the upside anyway. Today's upside breakout was accompanied by strong, but not overwhelmingly, positive breadth and so the recent sell signals have been canceled out. Still, unless breadth continues to expand over the next few days, this indicator will move back into sell status.

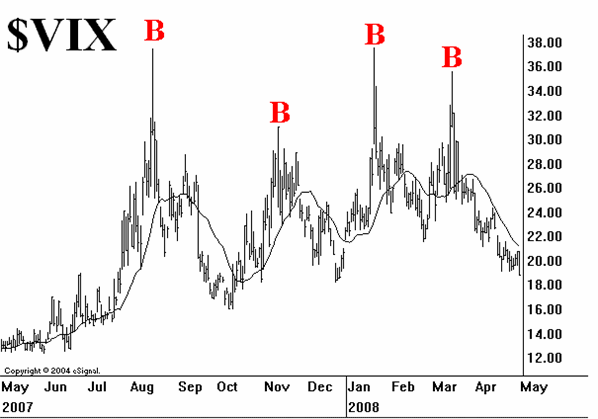
The volatility indices ($VIX and $VXO) have continued to decline since mid-March and as such have been on buy signals. As long as this downtrend in volatility continues, it is conducive to the bullish case. $VIX is now at its lowest levels since last December. At that time, the market reversed quickly and a bearish market leg developed. Currently, any reversal by $VIX back above 21 would be a warning sign, though, and a move above 23 would be a bearish signal.

In summary, this breakout is bullish and one has to trade from the long side as long as the indicators -- especially $VIX and the equity-only put-call ratios -- remain bullish. But don't get complacent, because the technical short-comings noted above are caution signs.
Lawrence G. McMillan is the author of two best selling books on options, including Options as a Strategic Investment, recognized as essential resources for any serious option trader's library.
|