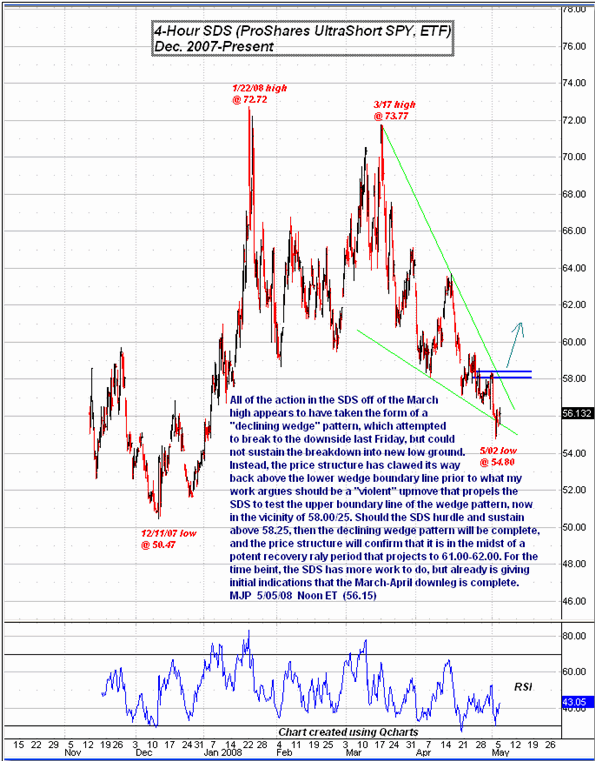
All of the action in the ultra-short SDS off of the March high appears to have taken the form of a declining wedge pattern.
All of the action in the SDS off of the March high appears to have taken the form of a declining wedge pattern, which attempted to break to the downside last Friday, but could not sustain the breakdown into new low ground. Instead, the price structure has clawed its way back above the lower wedge boundary line prior to what my work argues should be a violent upmove that propels the SDS to test the upper boundary line of the wedge pattern, now in the vicinity of 58.00/25. Should the SDS hurdle and sustain above 58.25, then the declining wedge pattern will be complete, and the price structure will confirm that it is in the midst of a potent recovery raly period that projects to 61.00-62.00. For the time beint, the SDS has more work to do, but already is giving initial indications that the March-April downleg is complete. 
Mike Paulenoff is a 26-year veteran of the financial markets and author of MPTrader.com, a real-time diary of his technical chart analysis and trading alerts on all major markets. For more of Mike Paulenoff, sign up for a free 15-Day trial to his MPTrader Diary by clicking here.