The S&P 500 Index ($SPX) closed above the key technical and psychological 1400 level on Thursday, and confirmed with another close above that level on Friday. Where do we go from here?
The S&P 500 Index ($SPX) closed above the key technical and psychological 1400 level on Thursday, and confirmed with another close above that level on Friday. The Dow Jones Industrial Average ($DJI) closed above 13,000 on both Thursday and Friday. The NASDAQ 100 Index ($NDX) closed just below 2000 on Friday at 1980. As you may know, nice round numbers are often key levels on both indices and stocks, both from a psychological and technical perspective, and because they are usually spots of high options open interest.
The question is, where do we go from here? I have previously written in recent weeks about summer underperformance in the NASDAQ, and also about how the major indices are right around key 50% retracement resistance levels, which may mark key reversal points. However, the markets have been strong and resilient over recent weeks, and as we often say "the tape (chart) tells the tale" and "the trend is your friend."
Let's examine the S&P 500 Index (proxy SPY) trends over a daily, weekly, and monthly perspective with some basic trendlines drawn in. You may have your own interpretations of these charts which differ from mine, which is fine.
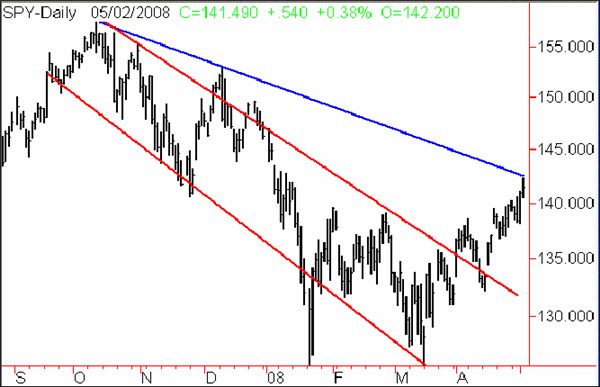
SPY DAILY CHART WITH TRENDLINES 
The daily SPY chart since the October 2007 highs looks to me like we are establishing a secondary top area within an overall bearish trend. I would expect a reversal lower based on these trendlines, but we may have not reached the short-term top yet.
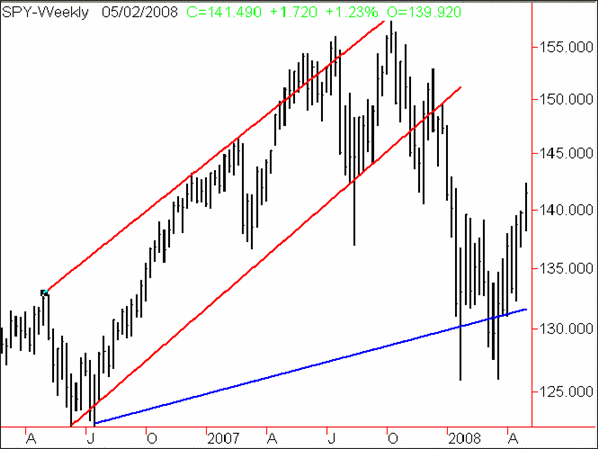
SPY WEEKLY CHART WITH TRENDLINES 
The weekly SPY chart since the 2006 bottoms looks like we have established a secondary, lower base within an overall uptrend. However, the severe nature and angle of the breakdown of the original trend indicates that the new uptrend will not be very strong and may, in fact, be a sideways trading range.
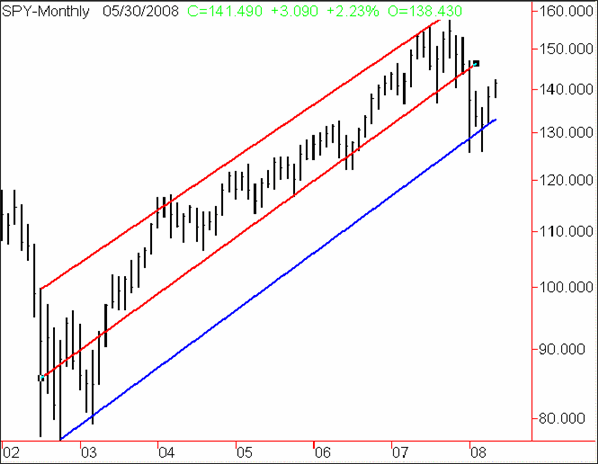
SPY MONTHLY CHART WITH TRENDLINES 
The Monthly SPY chart since 2002 lows is the most positive of the three charts examined, in my opinion. It indicates that we have only just established a nice secondary trend level in an overall strong uptrend, and the angle is about the same as the earlier uptrend. This reminds me of stock charts where you would see the underlying strength continue for quite some time, with pullbacks contained by the bottom trendline, which is rising.
The bottom line of these charts depends on the duration of your trades. If you are a short-term options trader, I would be very cautious here and expect volatility and a possible short-term reversal. Medium-term, it appears we are in a weak bull market and/or trading range. Long-term investors can be more confident in the underlying long-term uptrend.
Price Headley is the founder and chief analyst of BigTrends.com.